Often people think about public opinion too simply:
Liberals are liberal; conservatives are conservative.
But that’s not really how it works. When we look at data on lots of issues – abortion, birth control, same-sex marriage, affirmative action, immigration, healthcare, income redistribution, and so on – some people line up pretty consistently one way or the other, but many more combine liberal and conservative opinions.
To get at the details of public opinion, we look at some details of real lives – race, religion, gender, income, and various other features. This political calculator provides a quick glimpse using some of the biggest demographic predictors of issue opinions.
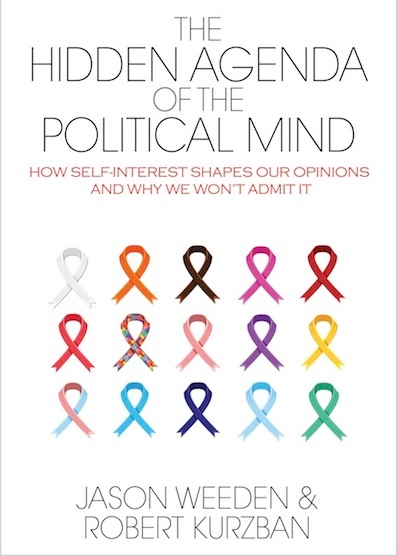
The results show how strongly people’s own situations affect their politics. People might often talk about themselves as objective truth-seekers who are just trying to do what’s best for everyone – but the demographic patterns reveal agendas that are more personal.
You'll probably be curious about people like yourself. Sure, check yourself out. Of course it's really not you, but averages based on people who share your features.
But the best part is checking others out. Enter Hillary Clinton's profile, or Marco Rubio's, or a typical working-class white in Kansas, or your infuriating relatives – you’ll probably have to make guesses on some information, but that’s OK. Enter voting groups that you find puzzling, and think about why their different lives might lead to different political views from yours.
The underlying data come from a big survey of Americans ages 18 and older. For the real nerds, there’s a link at the end discussing the methodology we used for the calculations.
Happy exploring!
