Between the 2012 and 2016 elections, evangelical and less-educated whites moved further toward Republicans, while non-Christian and more-educated whites moved further toward Democrats.
I’ve been maintaining a cumulative file of all the publicly released Pew political and religious surveys since the beginning of 2013. It’s simply enormous, currently containing data from over 100,000 respondents.
For today’s post, I was curious about the extent of recent changes in party identification across demographic groups, changes that are fairly subtle and require a ton of data to identify reliably. So I took my big Pew database and started looking for the major movements.
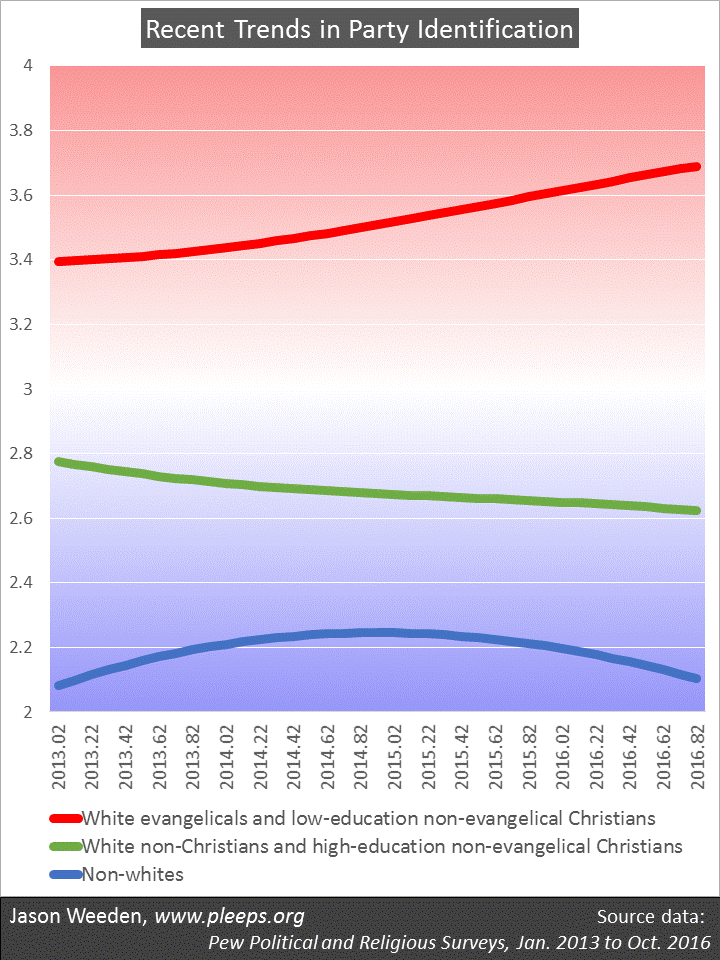
Turns out the basic story combines two themes, one involving white evangelicals vs. white non-Christians and the other involving non-degreed vs. degreed whites. Generally speaking, when looking from early 2013 to mid-late 2016, white evangelicals and non-degreed whites have tended to increasingly identify as Republicans, while white non-Christians and degreed whites have tended to increasingly identify as Democrats. More specifically, the groups shifting towards Republicans have been white evangelicals (of all education levels) along with white non-evangelical Christians without college degrees, and the groups shifting towards Democrats have been white non-Christians (of all education levels) along with white non-evangelical Christians with college degrees.
The chart below shows the trend lines. (The scale here assigns 1 to Democrats, 2 to independents who lean towards Democrats, 3 to non-leaning independents, 4 to independents who lean towards Republicans, and 5 to Republicans.) In addition to the directional shifts among the two white groups, non-whites had an interesting pattern of increased Democratic support near the presidential elections but softened support in the time in between.
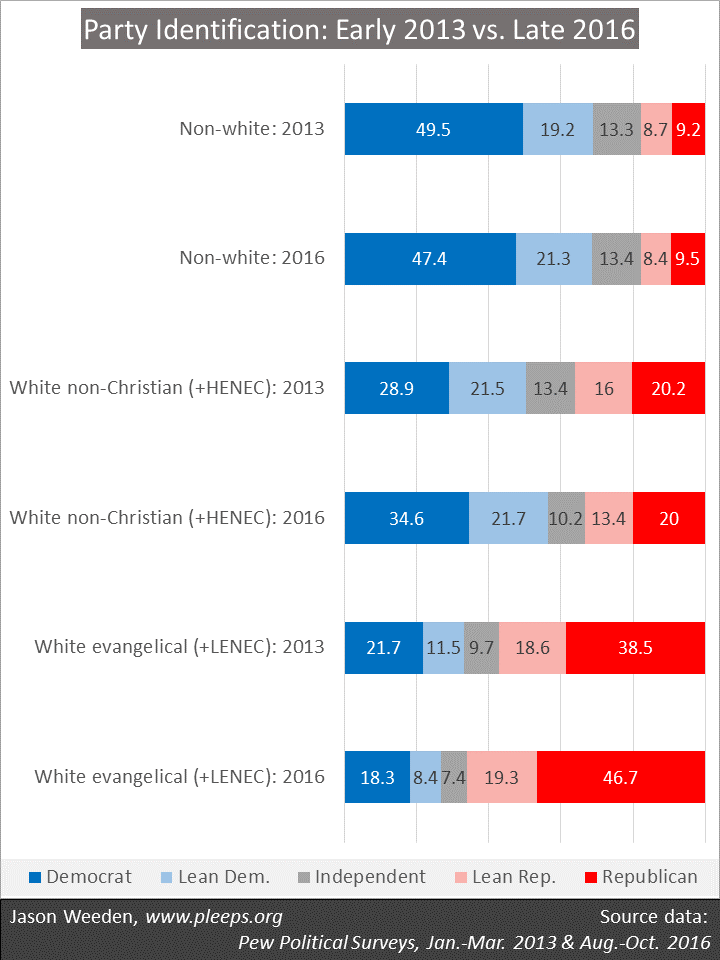
The next chart shows the percentage breakdowns at both ends of the time period, that is, in combined surveys from January to March of 2013 and from August to October of 2016. Comparing these two periods, non-whites are pretty similar, with around 69% landing or leaning Democratic and around 18% landing or leaning Republican. Among whites who are either non-Christian or degreed non-evangelical Christians, though, there was a noticeable shift—from 50% Democrat and 36% Republican in early 2013 to 56% Democrat and 33% Republican in mid-late 2016. And then there’s a particularly pronounced shift among whites who are either evangelicals or non-degreed non-evangelical Christians—from 33% Democrat and 57% Republican in early 2013 to 27% Democrat and 66% Republican in mid-late 2016.
 (Note: HENEC refers to high-education non-evangelical Christians and LENEC refers to low-education non-evangelical Christians, where the dividing line between “high” and “low” is whether they have 4-year college degrees.)
Two things worth mentioning here. First, there’s a basic overlap between evangelical identification and having less education, on the one hand, and non-Christian identity and having more education, on the other. As I’ve noted in prior posts, people who label themselves “born again or evangelical” Christians tend to be churchgoing Protestants with less education, while people with more education are relatively more likely not to be Christians.
Second, the recent party trends among whites don’t appear to be a specific response to Trump’s nomination. That is, evangelicals and less-educated whites were already moving in a more solid Republican direction before Trump, and non-Christians and more-educated whites were already moving in a more solid Democratic direction. In fact, it seems likely that Trump’s nomination was itself made possible by the long-term decline in Republican identification among those with the most education, though it also seems likely that his nomination and subsequent victory have further reinforced this decline.

