You can’t step into the same one twice.
According to the United States Election Project, around 137 million people voted for president in 2016 (out of 231 million who were eligible). In 2012, around 129 million voted for president (out of 222 million who were eligible).
Thus, there were lots of 2016 presidential voters who hadn’t voted for president in 2012—at the very least around 8 million. But, of course, it’s a much higher number than that. Some of the 129 million who voted in 2012 didn’t vote in 2016, either because they couldn’t (e.g., they died) or, more often, because they chose not to.
In fact, according to data recently released from the American National Election Studies (ANES), around 19% of presidential voters in 2016 hadn’t voted for president in 2012—that would be around 26 million out of 137 million. Further, around 12% of 2012 presidential voters who were eligible to vote in 2016 didn’t vote for president in 2016.
It’s understandable that folks prefer to think of the voting population as a rather fixed thing—as though, for example, when you look at Michigan in 2016 and see that Trump beat Clinton by 47.5% to 47.3%, while back in 2012 Obama beat Romney by 54.2% to 44.7%, then that probably means that the main story is that tons of Obama voters switched to Trump in Michigan. But it’s just really more complicated than that.
So let’s see some details from the ANES data. Here, I’m looking only at people who reported voting for president in either 2012 or 2016 (that is, I’m excluding people who didn’t vote for president in either election). In other words, it’s a sample of the combined 2012/2016 presidential voters, as surveyed in 2016 (which means it’s missing people who voted in 2012 but then died or otherwise became ineligible to vote before 2016).
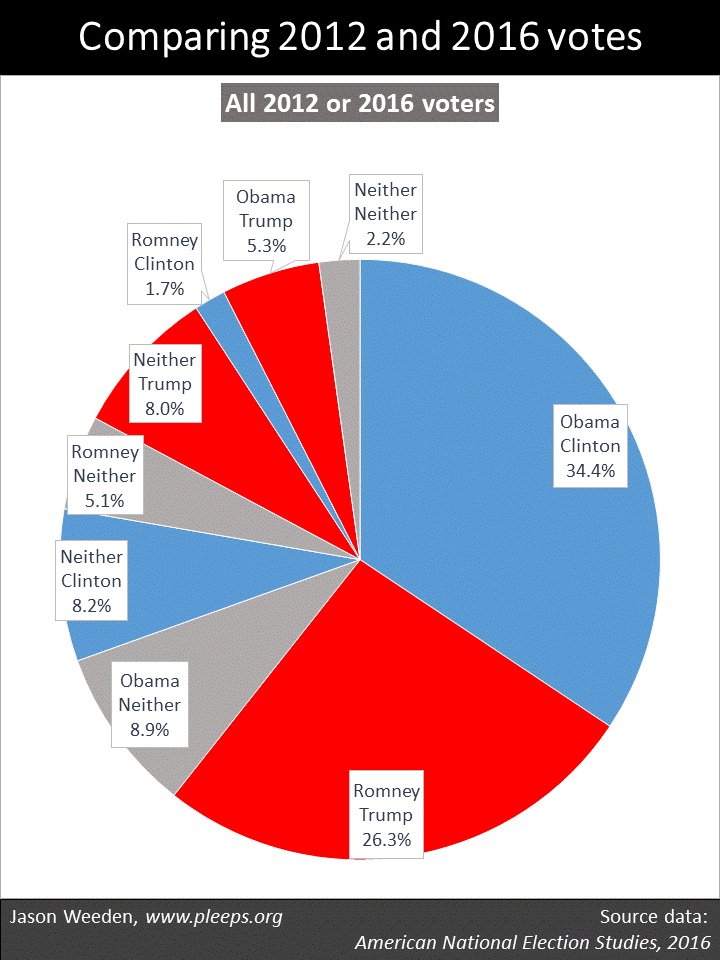
The first chart below shows the full sample of 2012/2016 presidential voters. It’s broken down by major-party votes (Obama vs. Romney and Clinton vs. Trump) along with “neither,” which combines non-voters and third-party voters. So, for example, the “Neither Neither” category combines people who voted third party in both elections, people who didn’t vote for president in 2012 and then voted third party in 2016, and people who voted third party in 2012 and then didn’t vote for president in 2016.
The results show a remarkably dynamic situation. Overall, in this sample of 2012 and 2016 presidential voters, around 61% voted for the same party in both elections. And then around 27% voted in one but not the other presidential election, including non-voters in 2012 who then voted in 2016 (17%) and 2012 voters who sat out 2016 (10%). And the other 12% voted in both elections but either switched between the major parties (7%) or switched between a major party and a third party/independent candidate (5%).
Given how close Trump’s Electoral College victory was, you can pin it on any number of causes. Would Clinton have won if more Obama voters had turned out? Yes. If she had been able to pull in more previous non-voters? Yes. If more Romney voters had sat this one out? Yes. If Trump had attracted fewer former non-voters? Yes. If she had converted more Romney voters? Yes. If Trump had converted fewer Obama voters? Yes.
Now, it’s certainly the case that Obama was more popular relative to Romney than Clinton was relative to Trump. This shows up in a number of ways. Most obviously, Obama’s popular vote win was bigger than Clinton’s popular vote win. And, according the ANES data, there were more Obama-to-Trump voters than Romney-to-Clinton voters. And, while both Clinton and Trump pulled in substantial numbers of prior non-voters, there were more Obama voters than Romney voters who sat out 2016 (or voted third party).
The thing I don’t get, though, is the continued narrative that particularly highlights Trump’s conversion of former Obama voters. Yes, it was a contributing factor. But, no, it doesn’t look like The Biggest Thing. Relative to the number who switched from Obama to Trump (5.3%), there were considerably more folks who had voted for neither Obama nor Romney in 2012 and then voted for Trump (8%) or who voted for Obama and then voted for neither Clinton nor Trump (8.9%).
A few subgroups
I suspect that many of my readers are surprised by the level and complexity of these electoral shifts. But I also suspect that many of my readers are college-educated whites. And college-educated whites are weird. Politically, among other things, they have high turnout rates and they’re much more likely than other folks to hold consistently liberal or consistently conservative positions.
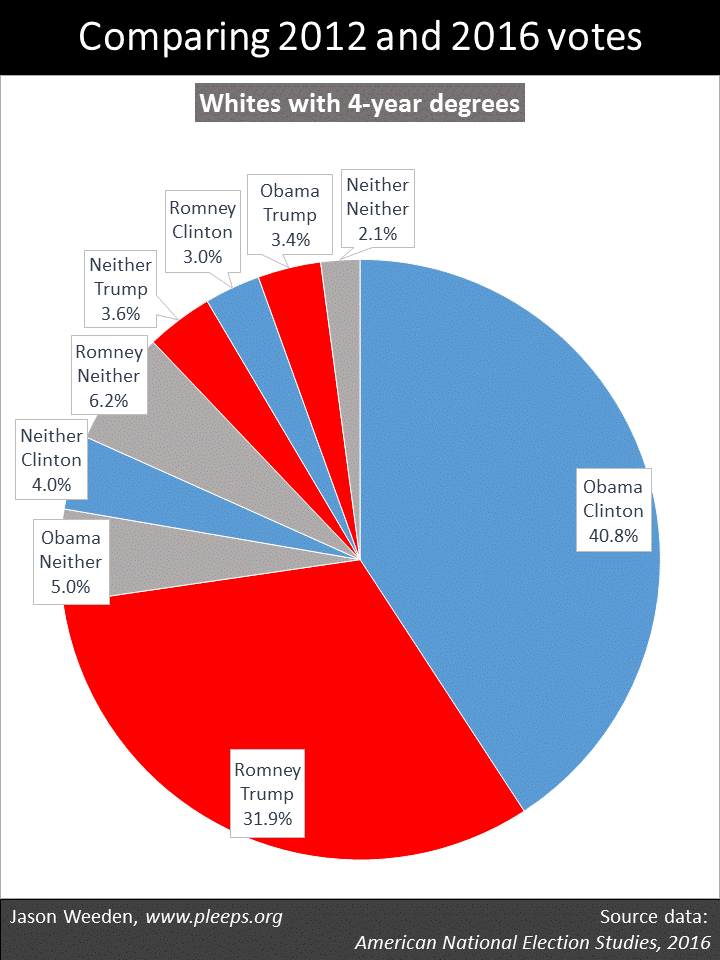
So you just don’t see as much electoral instability among college-educated whites. The chart below shows it pretty clearly in the 2016 ANES data. Here, around 74% were in the voted-for-the-same-party-in-both-elections club, 7% were new voters, 6% were drop-outs, 6% switched between major parties, and 6% switched between a major party and a third party/independent. Further, the dynamics from 2012 to 2016 among whites with 4-year degrees had roughly balanced effects on the 2016 race. For example, Clinton and Trump attracted about the same number of new voters, about the same number of Romney and Obama voters voted for neither Trump nor Clinton, and about the same number switched from Obama to Trump as from Romney to Clinton.
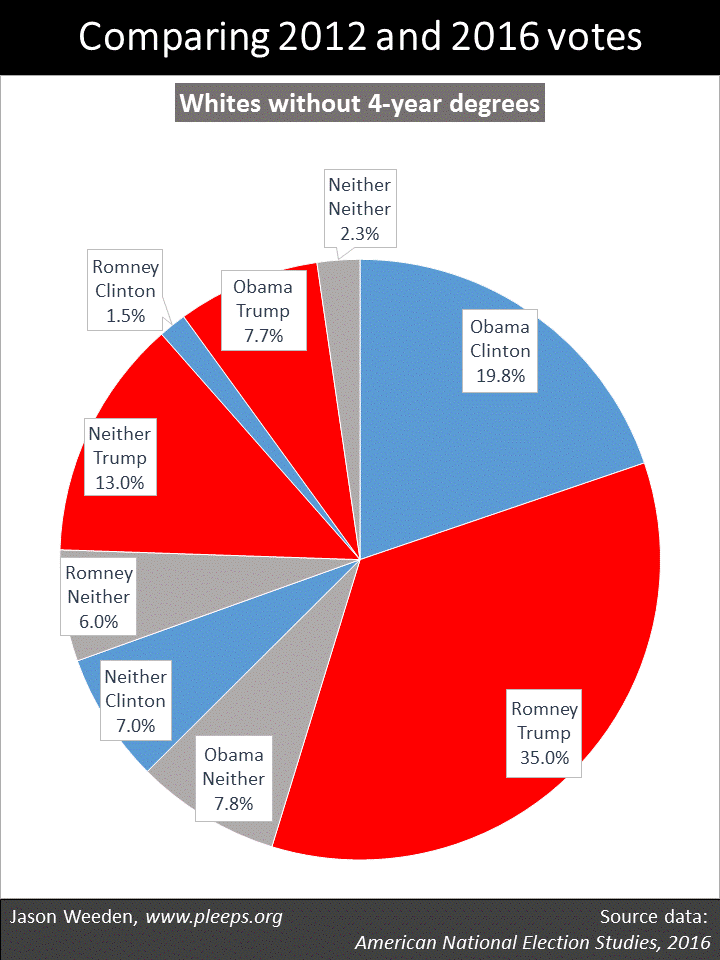
In contrast, things were just a lot less stable when you move away from degreed whites. The next chart below shows whites without 4-year degrees. For these folks, only around 55% were in the voted-for-the-same-party-in-both-elections camp. And you can really see Trump’s strengths with this group. In particular, while 35% voted for both Romney and Trump, another 13% voted for Trump after not having voted (or voted third party) in 2012, and then another 7.7% voted for Trump after voting for Obama in 2012. (Again, this doesn’t support a Trump-won-mainly-by-converting-Obama-voters narrative—there were substantially more new voters in Trump’s white working-class base than there were 2012 Obama voters, something I also found when I looked at recent data from the Cooperative Congressional Election Study (CCES).)
Non-whites also displayed similarly high levels of electoral instability when we compare 2012 with 2016, shown in the chart below. Here, only around 57% were in the voted-for-the-same-party-in-both-elections camp. Unlike non-degreed whites, though, when non-whites did turn out to vote, Democratic candidates had an enormous advantage. But there’s great variance in turnout. In this ANES sample of 2012/2016 voters, around 15% of non-whites voted for Obama but then not for either Clinton or Trump, which was almost exactly offset by around 15% who had voted for neither Obama nor Romney but then voted for Clinton.
The ANES data on non-whites does suggest, though, some real weaknesses for Clinton relative to Obama. In general, one might have expected a larger portion of new Clinton voters relative to dropout Obama voters from at least a couple of sources—including from younger folks who came of voting age since 2012 and from recently naturalized immigrants. Further, there were hardly any Romney-to-Clinton converts among non-whites, while there was a small but not insignificant number of Obama-to-Trump converts. Indeed, in a pretty startling bit of detail, there were more non-whites who didn’t vote for Romney and then voted for Trump (8%) than who did vote for Romney and then voted for Trump (6%).
Yeah, but …
Yeah, but, it’s just one sample. True. It’s always better to have multiple independent data sources when addressing complex issues. I will say, though, that one of my main conclusions—that, among non-degreed whites, Trump had more prior non-voters than Obama converts—looks pretty similar in the ANES sample here as it did when I looked at the 2016 CCES sample. Now, having said that, I can also report a major difference between the ANES and CCES samples—the latter has fewer 2016 non-voters and, relatedly, more same-party 2012/2016 voters. I haven’t yet developed a good sense of why that is.
Yeah, but, retrospective surveys inflate the winner’s support, and in this case will especially inflate Obama’s support in 2012. Also true. Indeed, a suspiciously high percentage of the ANES sample report voting for Obama relative to Romney in 2012. Two things, though. First, you actually should expect some degree of Obama inflation here relative to Romney. This is because Romney did particularly well with seniors and, not to put too fine a point on it, people who were seniors in 2012 are less likely to show up in a 2016 survey than people who were not seniors in 2012. But, still, the Obama vs. Romney numbers remain high. Which raises a second point: If you think that the Obama vs. Romney numbers are off in favor of Obama, what that means is that you think that the number of Obama-to-Trump converts is probably even lower than these samples are showing. And, likewise, you think that the number of new Trump voters is probably even higher. That is, if anything, these samples are probably underreporting the extent to which new Trump voters outnumbered Obama converts.
Will Trump have his own midterm problems?
Before 2016, the presidential and midterm elections from 2008 to 2014 were marked by seesawing variations in the partisan makeup of the voting population. Obama scored strong victories in his presidential elections, only to be followed by a “shellacking” in both midterms. Prior to 2016, this created a conventional wisdom about how Democrats do well in presidential years but not midterms. After 2016, though, conventional wisdom shifted: This wasn’t a phenomenon about Democrats but more specifically about Obama—when Obama was personally on the ballot, he drew out a segment of supporters who don’t typically vote.
So now it seems we might see something similar with Trump. He drew out his own segment of supporters who don’t typically vote—whites without college degrees who are younger and poorer. It could be that many of them grow disillusioned with Trump, given that he seems likely to break some of his populist promises (e.g., to make sure everyone has better and cheaper healthcare). But we could also see a more basic Obama-like phenomenon, where many of Trump’s new voters simply don’t show up in midterms when he isn’t personally on the ballot, even if they’ll turn out in 2020 when he is.
We’ll have to wait and see. The details of who turns out to vote from year to year are messy, complicated, ever-changing. Or as Socrates put it (according to Plato): “Heracleitus says, you know, that all things move and nothing remains still, and he likens the universe to the current of a river, saying that you cannot step twice into the same stream.”


