Some key political trends over the past decades are probably pretty well known. Views on issues involving race have become substantially more liberal over the past 40 years. Views on some lifestyle issues (e.g., on same-sex marriage and marijuana legalization) have recently become more liberal (though views on abortion have not). Before the 1980s, many more Americans identified as Democrats than Republicans; since the 1980s, Democrats are still more numerous than Republicans, but less so.
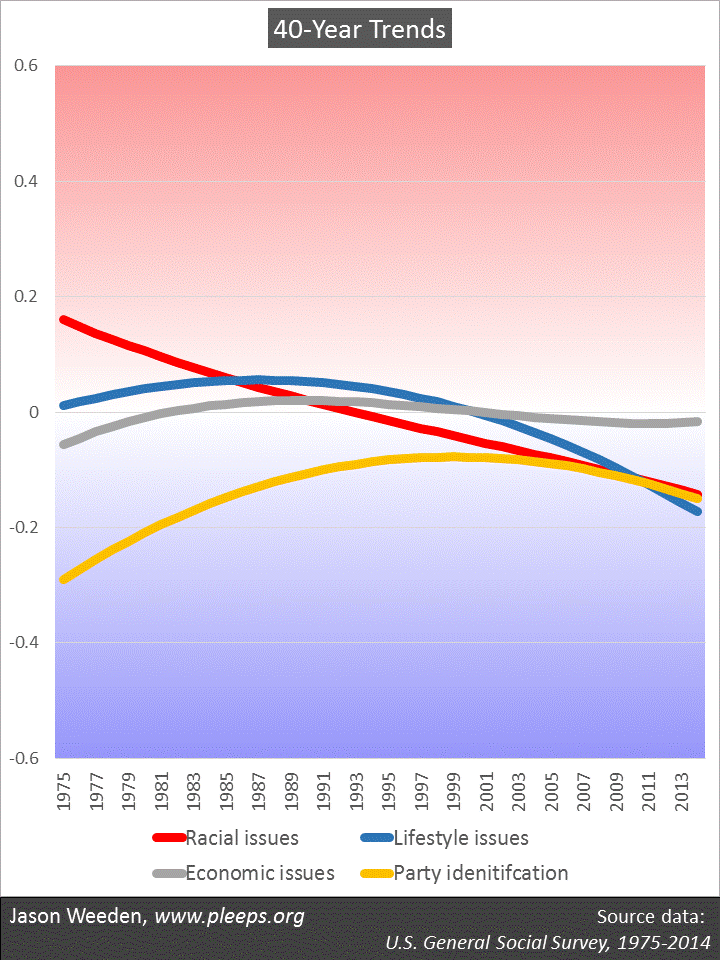
The chart below shows some high-level trends using U.S. General Social Survey (GSS) data from 1975 to 2014. Basically, I combined public opinion responses to a number of racial issues, lifestyle issues, and redistributive economic issues that have been frequently asked over the years. I converted these issue scales as well as party identification into standardized measures to make them directly comparable; values above 0 represent more conservative views and values below 0 represent more liberal views (or, in the case of party identification, represent Republican vs. Democratic skews).
And, sure enough, there it is. The U.S. public has become steadily more liberal on racial issues and has recently become more liberal on lifestyle issues, while views on economic issues have remained relatively flat. With party identification, the Democratic advantage shrunk through the late-1970s and the 1980s, leading to a weaker Democratic advantage in the 1990s to the present.
Some of these trends relate to overall demographic changes. One of the biggest involves education. According to GSS data, in the late-1970s only around 30% of the adult population had ever attended college; by the early-2010s this almost doubled to around 57%. Another big change has been rising racial diversity. In the late 1970s (again, from GSS data) around 86% of adult residents were non-Hispanic whites; by the early-2010s this had declined to around 67%. In addition, religiosity has continually declined over these years, as church-attendance rates have crept down and the percentage of religious “nones” has increased for each generation going back to those born in the late-1930s (something I showed in a prior post).
Given that racial minorities and high-education whites tend to be more liberal on racial issues, increasing racial diversity and increasing education levels should predict an overall liberalization of views on racial issues. Similarly, given that less-religious and more-educated folks tend to be more liberal on lifestyle issues, decreasing religiosity and increasing education levels should predict an overall liberalization of views on lifestyle issues. With economic issues, however, there are substantial cross-currents. Increasing racial diversity should predict more liberal economic views, but increasing percentages of high-school graduates and college attendees should predict more conservative views.
With party identification, matters are yet more complex. Parties are coalitions where the demographic fundamentals can change over time. And, indeed, they’ve changed in some pretty significant ways in the past 40 years. In the mid-20th century, the coalitions pitted Democrats’ combination of working-class folks and southern Dixiecrats against Republicans’ smaller group of wealthier and better-educated WASPs. But these days the coalitions more centrally involve Democrats’ combination of minorities and high-education non-Christians vs. Republicans’ white Christians (particularly those who are more religious and/or wealthier-but-not-highly-educated).
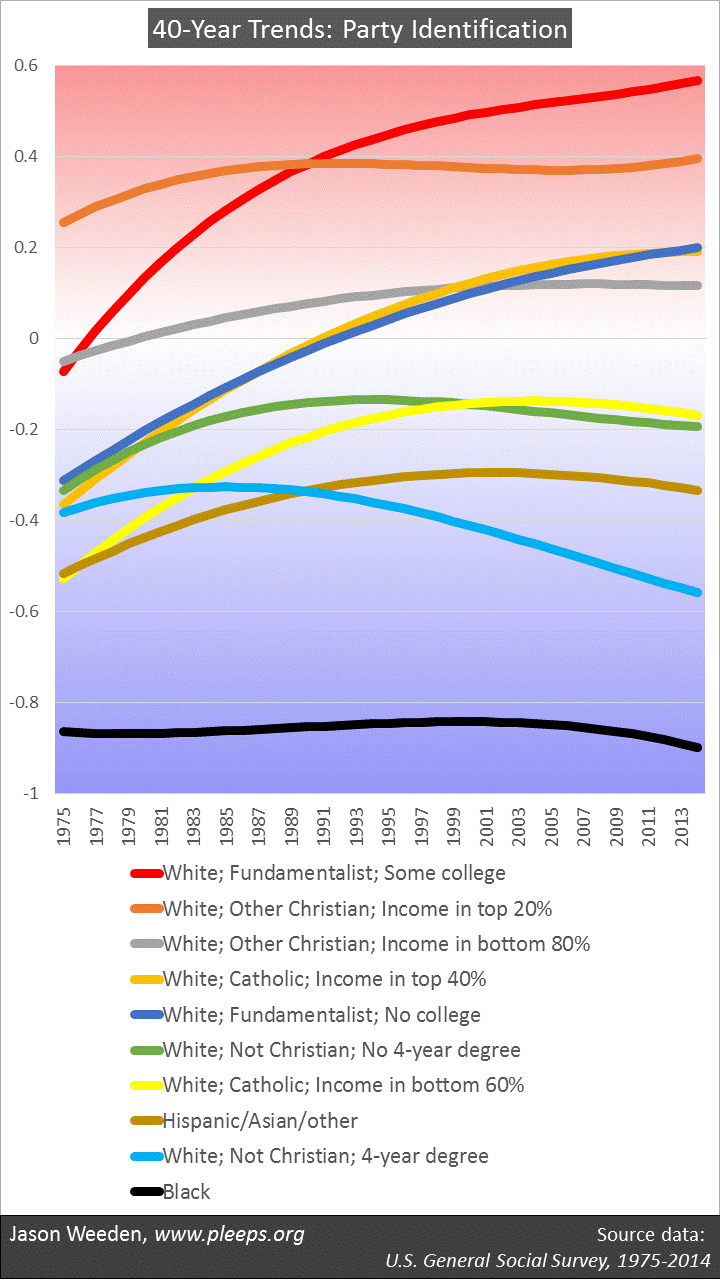
So, when we look at party identification broken down by demographics, there have been some big shifts in the past decades. The chart below gives a view of this, splitting the public into various demographic categories. The main divisions involve race and white religious affiliation (non-Christians vs. Catholics vs. fundamentalist Protestants vs. “other” Christians, i.e., mostly non-fundamentalist Protestants). I then did one further split within each white group, based on whatever demographic item was statistically the biggest deal (which turned out to be education for fundamentalists and non-Christians and income for Catholics and “other” Christians).
You can see in the chart above that various groups had major Republican shifts. White fundamentalists with at least some college attendance (the red line) went from being pretty evenly split between Democrats and Republicans in the mid-1970s to being the most Republican group. Both white Catholics with household incomes in the top 40% (the light-orange line) and white fundamentalists without college attendance (the dark-blue line) went from substantially favoring Democrats to significantly favoring Republicans. Also, white Catholics with incomes in the bottom 60% (the yellow line) went from strongly favoring Democrats to only modestly favoring Democrats. These sorts of shifts happened not just through generational replacement, but also from large numbers of middle-aged adults changing parties, something that undermines the frequent story from political scientists about the supposed fundamental stability of party identification.
Blacks have been remarkably consistent, remaining a very strong Democratic constituency over the past 40 years. And only one group has become decidedly more Democratic over time: white non-Christians with 4-year college degrees. They’ve favored the Democratic coalition throughout the survey period, but in the past 20 years have moved significantly further in that direction.
Within-demographic shifts in issue opinions
As I mentioned, some of the large-scale shifts in issue opinions have been driven by demographic changes, as a more educated, more racially diverse, and less religious population adopts more liberal racial and lifestyle positions. Yet there are still some interesting shifts within demographic groups.
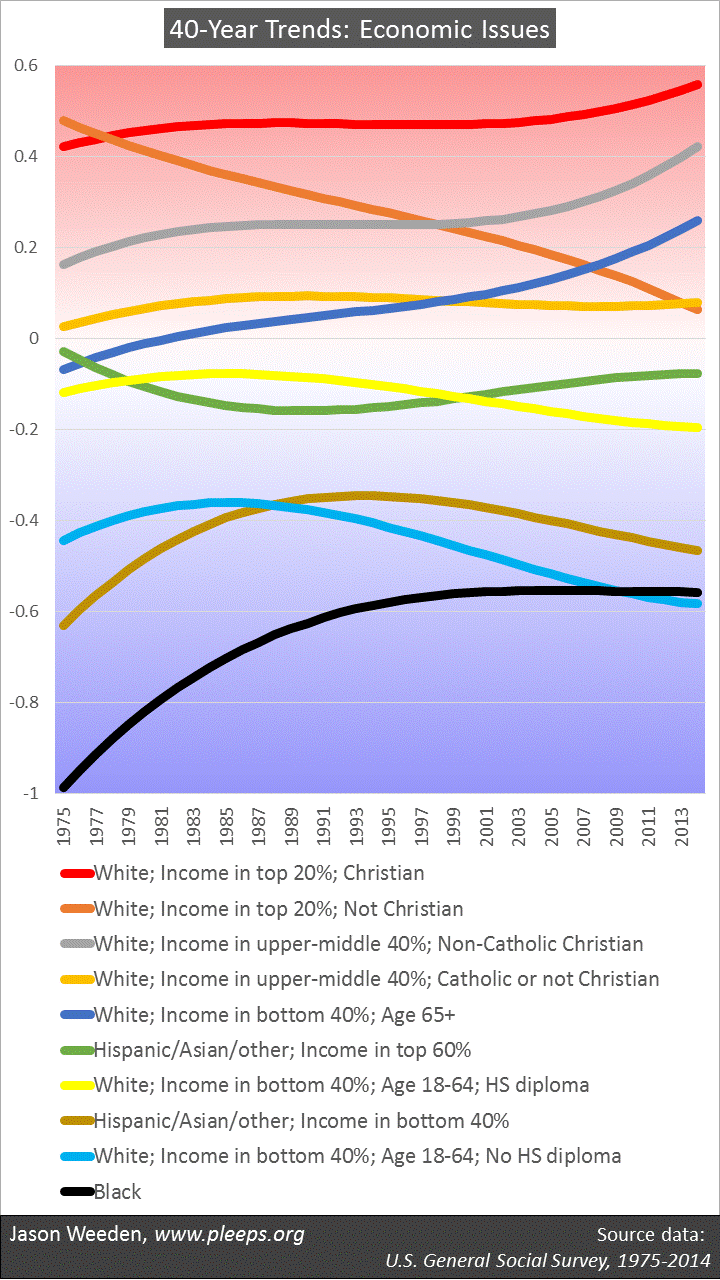
The chart below shows trends in opinions on rich-poor redistributive economic issues (e.g., whether the government should do more to equalize income differences between the rich and poor). Here, it has generally been the case that wealthier whites are more conservative and poorer minorities are more liberal, but there have also been some large shifts. For example, blacks went from being incredibly liberal in the mid-1970s to merely really quite liberal in the 1990s and later years. This relates in part to increasing black education and income over these years. And then there’s also a really big liberal shift among wealthier white non-Christians (the dark-orange line). I discussed this shift in a prior post, identifying it as a key component of current ideological clustering—that is, if you’re wondering how ideological consistency increased in recent years, and why it has been a lot more pronounced among college-educated whites, the place to start is with the uniquely substantial liberalization of economic views among wealthier white non-Christians.
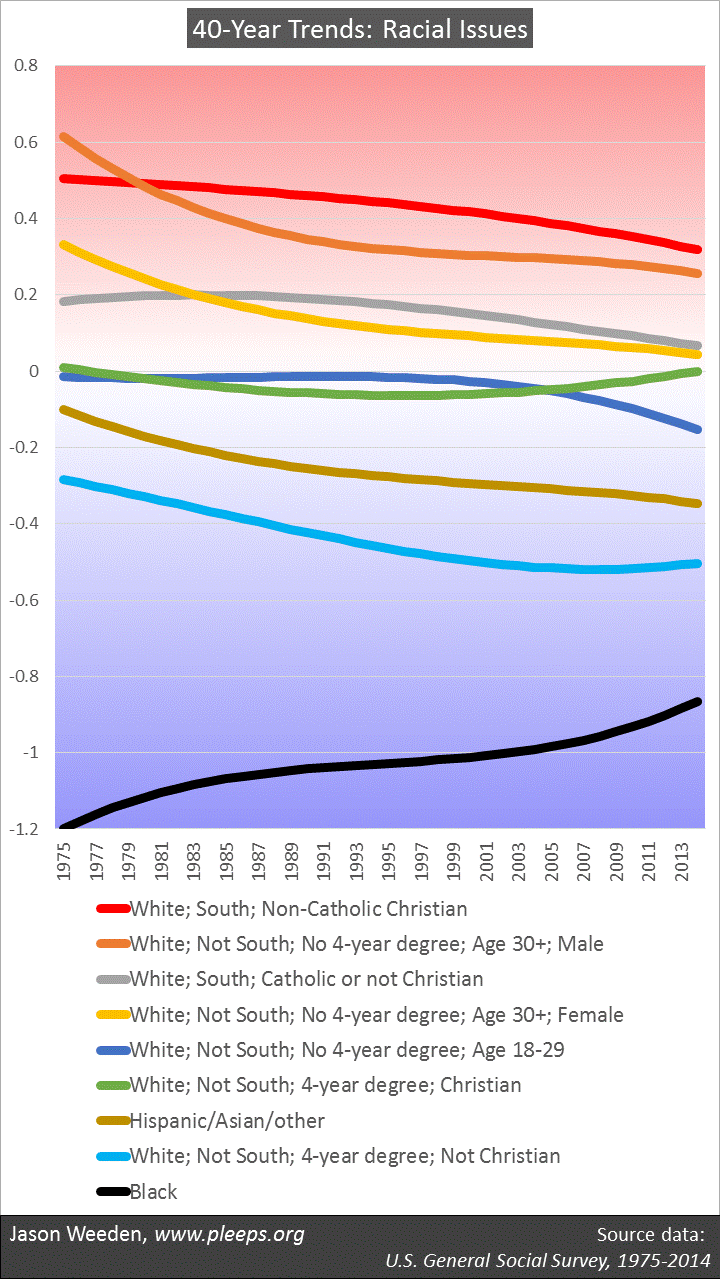
The next chart shows trends in racial opinions (e.g., views on discrimination against blacks and on government spending on blacks). It has generally been the case that more conservative views are held by whites, especially when less-educated, southern, and/or Christian, while particularly liberal views are held by blacks. Yet there are interesting shifts here as well. Primarily, while most non-black groups have become more liberal over time, blacks themselves have become less liberal, though they remain easily the most liberal group on these issues.
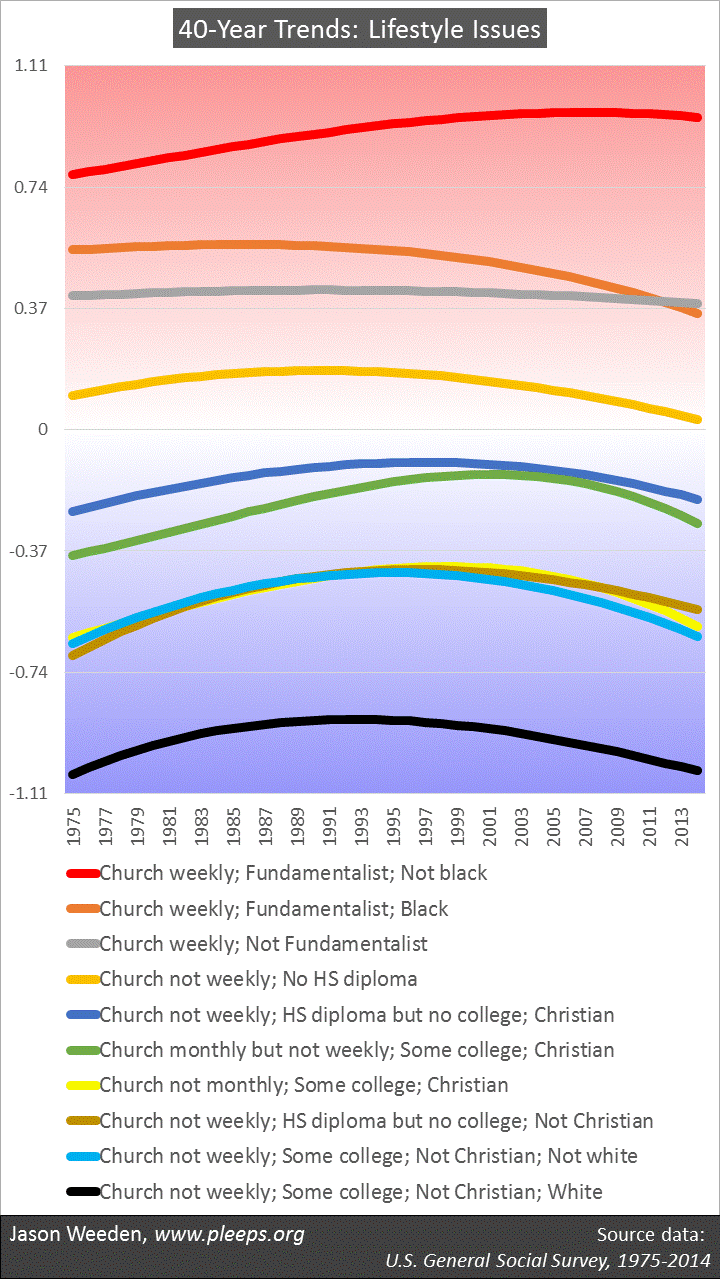
The last chart below shows trends in lifestyle issue opinions (on abortion, homosexuality, marijuana legalization, etc.). Here, the main predictor is religious service attendance—people who go about once a week or more are on average a lot more conservative on these kinds of issues. The liberals tend to be less religious and better educated.
There are some interesting trends going on in this last chart. One trend helps clarify why the public as a whole wasn’t getting much more liberal on these lifestyle issues over the late-1970s to early-1990s, despite the public’s decreasing religiosity and increasing education levels. In short, lots of groups were experiencing within-group conservative shifts over these years that were offsetting the shifts in overall demographic composition. So, think of yourself on the bank of a river flowing right-to-left, watching swimmers swimming left-to-right. If the swimmers match the speed of the river, in some sense it looks like they’re remaining stationary. For most groups, though, this changed around the mid-1990s. They started swimming right-to-left. This produced especially rapid leftward changes in public opinion as a whole on these lifestyle issues, as overall demographic changes and within-group shifts operated in the same liberal direction.
Another set of interesting points here involves the intersection of race and religion. Notice that, among weekly attending fundamentalists, blacks have been less conservative on lifestyle issues than non-blacks (and, further, the black vs. non-black gap among weekly churchgoing fundamentalists has been growing). But among college-educated non-Christians, whites have been more liberal than non-whites. Here, the main point isn’t that whites are either more conservative or more liberal on these lifestyle issues; it’s that the basic religious differences are just a bigger deal in predicting lifestyle issues among whites. These are further clues as to why ideological consistency has been increasing particularly among educated whites—many facets of their politics have become more centrally organized around basic religious differences.
The veiled mysteries of the future
There’s a fundamental stability to some kinds of political variables. On the core issue domains I’m looking at here—on redistributive economics, on race, and on lifestyles—the same basic domain-specific demographic divisions tend to hold over time. Indeed, as Kurzban and I discussed briefly in our book (at the end of chapters 4, 5, and 6), these kinds of issues also tend to be predicted by similar domain-specific demographics across the globe. Our argument is that this kind of stability reflects deep facts about the important role of self-interest on various kinds of issue opinions.
But this isn’t to say that interest-relevant, domain-specific demographics are the full story. Another big theme is coalitions, which are fundamentally flexible and contingent. They’re always changing. We just saw an example above in the demographic shifts in party identification. And these coalitional changes have their own effects on some coalition members’ issue positions. And, then, of course, there’s more going on with issue opinions than just coalitions and basic demographics.
All this makes forecasting political trends rather dicey. Primarily, party coalitions aren’t set in stone. You can’t sensibly make “demographics as destiny” claims about party identification. Yes, basic demographics are a really big deal in party identification these days. And, yes, demographics are changing in favor of the current Democratic coalition, as white Christians decline relative to non-whites and white non-Christians. But this doesn’t necessarily say much about the future, because the dividing lines of party coalitions can and do change over time. They’re changing right now. The 2016 election involved some further evolution as low-education whites were particularly attracted to Trump’s white nationalist version of Republicanism (something that showed up in both the exit polls and state-level shifts).
It’s a bit safer to make guesses about broad changes in some kinds of issue opinions, but, even here, one shouldn’t be too confident. For example, the population was getting better educated and less religious from the late-1970s to the mid-1990s, and the population was also getting better educated and less religious from the mid-1990s to the present, yet the population in the former time period wasn’t getting more liberal on lifestyle issues as a whole, whereas now it is. I don’t know that anyone has a good idea about why that is.
An overarching lesson is that one ought never get too attached to a particular set of facts. The determinants of party identification can be relatively stable over a given time period; and then they can change. Demographic shifts often lead to expected aggregate opinion changes; and sometimes they don’t. Demographic shifts themselves are hard to project into the future. For example, fertility and religiosity had been declining throughout the early 20th century, but then the trend lines suddenly and dramatically reversed in the 1950s, something that I don’t think anyone has ever actually explained (instead, lots of researchers just pretend that the 1950s were a generic representation of pre-modern times, which they totally were not). Or, for another example, think about how badly mistaken all those 40- or 50-year projections regarding the racial composition of the U.S. might become if the U.S. actually implements substantial efforts to deport undocumented immigrants and reduce future non-white immigration.
The good news is that all this is a kind of full employment act for social scientists. It’s never a given that past patterns will continue. The only way you’ll know what’s going on is to keep gathering and analyzing new data.

