Tyler Cowen and Noah Smith recently discussed employment. Cowen mentioned “structural factors” responsible for the recent decline in young men’s labor force participation. When Smith asked what these were, here was Cowen’s answer: “[T]he internet may be the biggest. It is easier to have fun while unemployed. … Maybe employers just aren’t that keen to hire those males who prefer to live at home, watch porn and not get married.”
Cowen is getting this in large part from economist Erik Hurst. Hurst recently summarized some of his points in a speech posted online. The basic argument is that young men (particularly young men without college degrees) are increasingly avoiding work and marriage and living in their parents’ homes in large part because of the lure of the internet and video games. (Derek Thompson has also discussed Hurst’s claims at The Atlantic here and here.)
This struck me as roughly plausible when I first heard it. But then I started focusing in on some of the details. For example, Hurst talks about work and marriage trends of men in their early 20s without really addressing college trends. For example, in discussing the decline in the employment of young men, Hurst notes: “You might think it’s matched by a rise in school attendance for this age group. That is not the case.” Yeah, OK, not “matched,” but how much is offset by school attendance? If, say, 75% of the employment decline is offset by college attendance, then it’s a very different picture than if only 25% is. Another example of a problematic detail is that Hurst makes his points by comparing 2000 with 2014/2015. This compares a strong overall labor market to a weak one. I mean, look, the employment rate for women in their 20s in 2000 was around 71% but in 2014/2015 was only around 66%. The male drop may be bigger, but, again, it matters how much bigger. We need to see some pretty impressive numbers here to believe that we’ve entered a new normal where the draw of online entertainment is keeping lots of young men in their parents’ basements and away from reality-based pursuits.
Basically, these moves tend to artificially inflate the importance of the phenomenon Hurst is discussing. And there are others he uses as well—e.g., making comparisons within the non-degreed when the percentage of non-degreed men is dropping over time (i.e., a bigger problem within a smaller group may not ultimately imply a much bigger problem overall); e.g., talking about marriage drops without simultaneously discussing rising non-marital cohabitation; e.g., talking about living with “parents or close relatives” as though living in an apartment with a similar-aged sibling or cousin is equivalent to living in one’s parents’ basement.
There may be something there, but before we get too excited we need a deck that is less stacked. So I decided to go check some numbers myself. I ended up running two analyses. In the first, I take a long view of male employment and school enrollment using BLS and Census data. In the second, I use the National Longitudinal Surveys of Youth to get a very detailed look at men in their mid/late-20s. The overall picture tells me that the idle-men-living-with-parents thing isn’t (yet) a big enough deal to justify talk of a new normal, much less to justify expansive views on its motivating causes.
Long-term trends in young men’s school and work
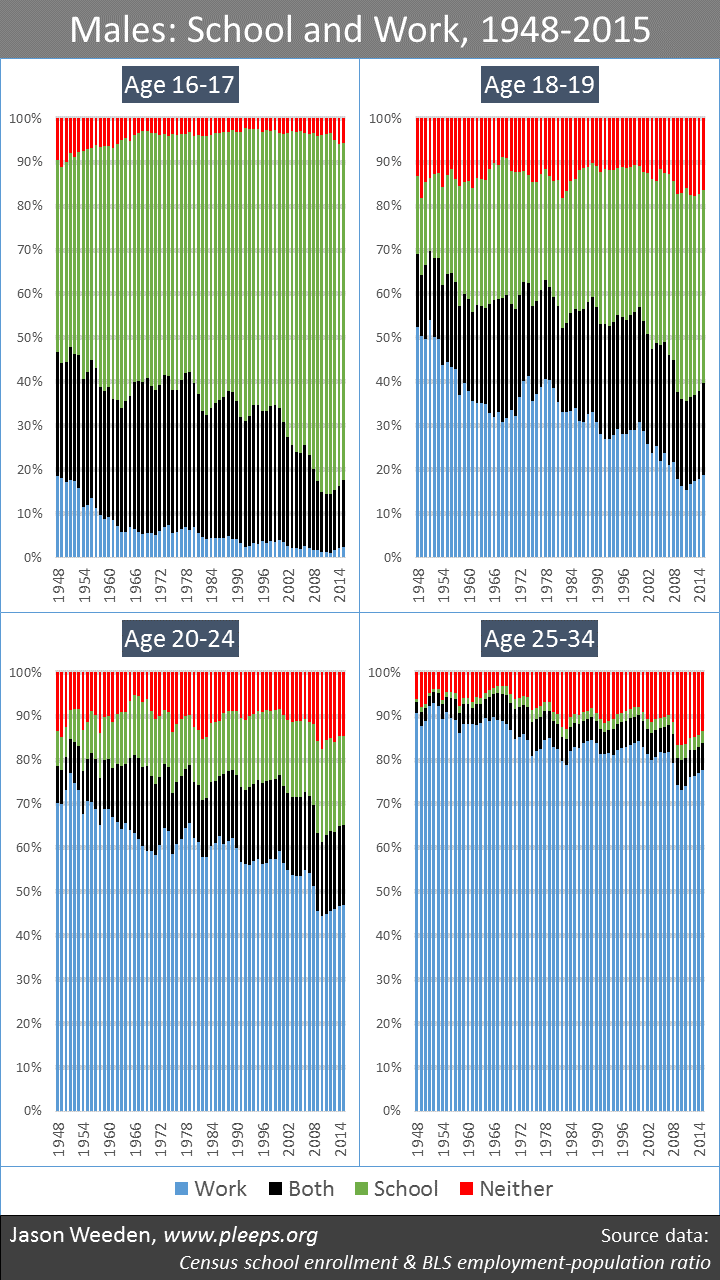
Here I took BLS data on employment-population ratios from 1948 to 2015 and combined it with Census data on school enrollment from 1948 to 2014 (and used 2014 numbers to fill in 2015, which isn’t available yet). From these sources, we can get the percentage in school and the percentage working, but the wrinkle is that there’s some overlap (i.e., men both working and in school). I used the National Longitudinal Surveys of Youth to come up with age-specific estimates of the typical relative work rates of those in school and not in school and used the same relative rate to allocate the overlap in each year—this could throw the numbers off if this relative rate has been changing over time, so take this with that grain of salt.
The chart below shows the trends. Start with the chart for ages 16 and 17 (in the upper-left corner). The blue bars on the bottom are young men working but not in school and the black bars are young men both working and in school—combine these and that’s the BLS employment-population ratio from that year. The green bars are those in school but not working—combine green with black and that’s the Census school enrollment figure from that year. The red bars up top are the idle young men, not in school and not working. For those ages 16 and 17, there has obviously been a big drop in employment, with the combined black and blue sections totaling over 40% in the 1950s but less than 20% following the Great Recession. But was the decline generally offset by the rise in school attendance? Yes, clearly. In fact, there were more idle 16/17-year olds in the 1950s than there are now. There has been a slight rise in the past few years due to declining school attendance, but it doesn’t look to me like it’s enough to panic over. In general, the 16/17 guys are working less than they used to and in school more, but there’s no indication of an important new trend in idleness here.

Let’s move to ages 18 and 19 (upper-right corner). Again, there’s a big drop in labor force participation, from over 60% in the 1950s to less than 40% following the Great Recession. But, again, it’s been mostly offset by increases in school enrollment. The red bars—representing idle young men—have fluctuated between lows around 10% and highs in the 15%-20% range, but without a strong linear trend. The idleness rate is at the high end now, but is about where it was at the height of the major recession in the early 1980s. That’s a real problem, but (1) it’s not some new historically unprecedented level and (2) it’s probably too early to talk about whether the new high level will persist, particularly given the slow-but-steady upward trend in employment since 2009.
The story for men ages 20 to 24 (lower-left corner) is similar to the story for 18/19-year olds. Employment has been dropping, but rising school enrollment has mostly offset the employment drop. We’re now at a high-but-not-unprecedented level of idleness among the 20 to 24 guys, with slowly rising employment numbers since 2009. Again, I don’t see how these numbers can reasonably be sold as a new normal caused by internet/porn/video games.
And now we get to the men ages 25 to 34 (lower-right corner). Here we see a similar story, but with a somewhat more worrisome ending. Employment has dropped since the 1960s, with a huge drop in 2009 that has slowly but only partially recovered since. Education has picked up some of that slack but not all of it, leading to increased idleness rates. The percentage of men ages 25 to 34 not working and not in school increased from an average of around 5% or 6% in the 1950s to 1970s, to around 10% from the 1980s to 2008, to over 16% at the height of the Great Recession, and back down to around 14% in the past couple of years. Is there a troubling trend? Yes. Is it a new normal? Maybe, or maybe not.
Overall, I’d say that (1) we’ve clearly seen long-term trends away from work and towards school for young men, (2) for young men ages 18 to 34 the Great Recession resulted in an abrupt decrease in work that was not meaningfully offset by increased school enrollment, which led to higher idleness rates, (3) for younger young men these idleness rates are basically in line with past serious recessions, (4) but for older young men the idleness rates have been unusually elevated, though declining steadily since the height of the Great Recession. I’m just not sure how compelling a they-love-video-games-too-much-to-want-to-be-productive story is here.
A closer look at mid/late-20s men
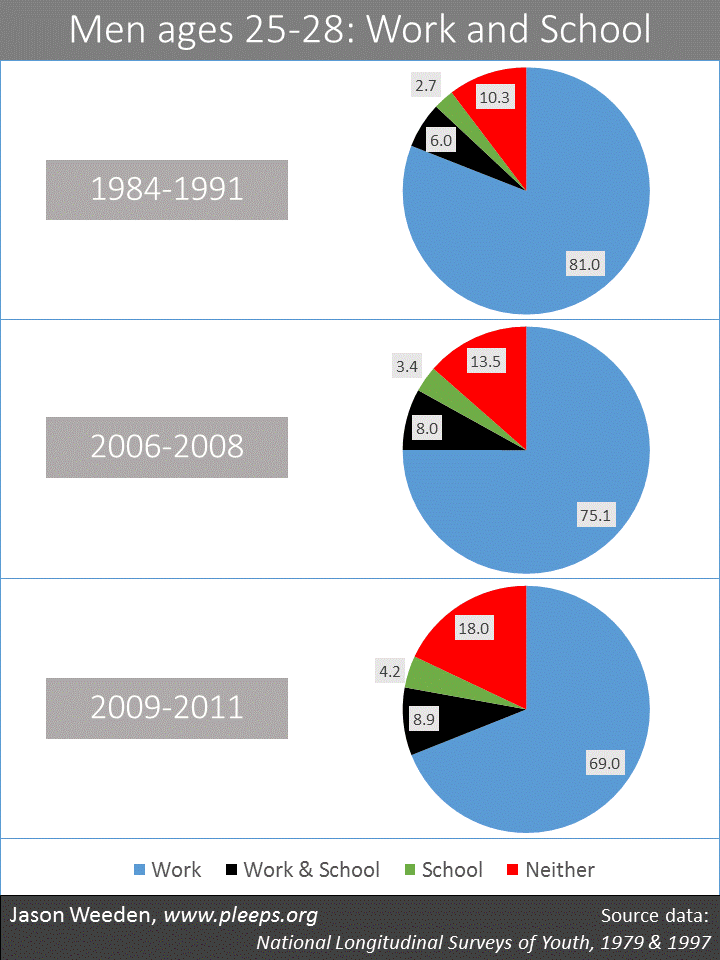
Next I turned to the National Longitudinal Surveys of Youth, both the 1979 panel and the 1997 panel, which give a fuller view but of more limited samples. They have most of the variables we’re interested in—work, school, marriage, cohabitation, and living with parents. They also present a happy accident. As we just saw, we’re mostly interested in men 25 to 34. Not only have the NLSY samples surveyed men in this range, but the 1997 panel ended up catching men ages 25 to 28 both right before and in the early years of the Great Recession. This allows for a three-way comparison—we can look at the 25 to 28 men (1) from the 1979 panel surveyed mostly from 1984 to 1991 (which overall were relatively strong economic years), (2) from the 1997 panel surveyed from 2006 to 2008 (another relatively strong economic period), and (3) from the 1997 panel surveyed from 2009 to 2011 (a very weak economic period). This allows a comparison of a pre-internet strong period and a post-internet strong period, and then a second comparison of immediately pre- and post-Great Recession.
The chart below looks at work and school for these NLSY men ages 25 to 28. We do see an increase in those neither working nor in school (the red wedges) from the 1984-1991 period to the 2006-2008 period—from 10.3% to 13.5%. And then the Great Recession abruptly increased this to 18%. As was generally the case in the earlier chart for men ages 25 to 34, we see a substantial decrease in work coupled with a smaller increase in school enrollment.

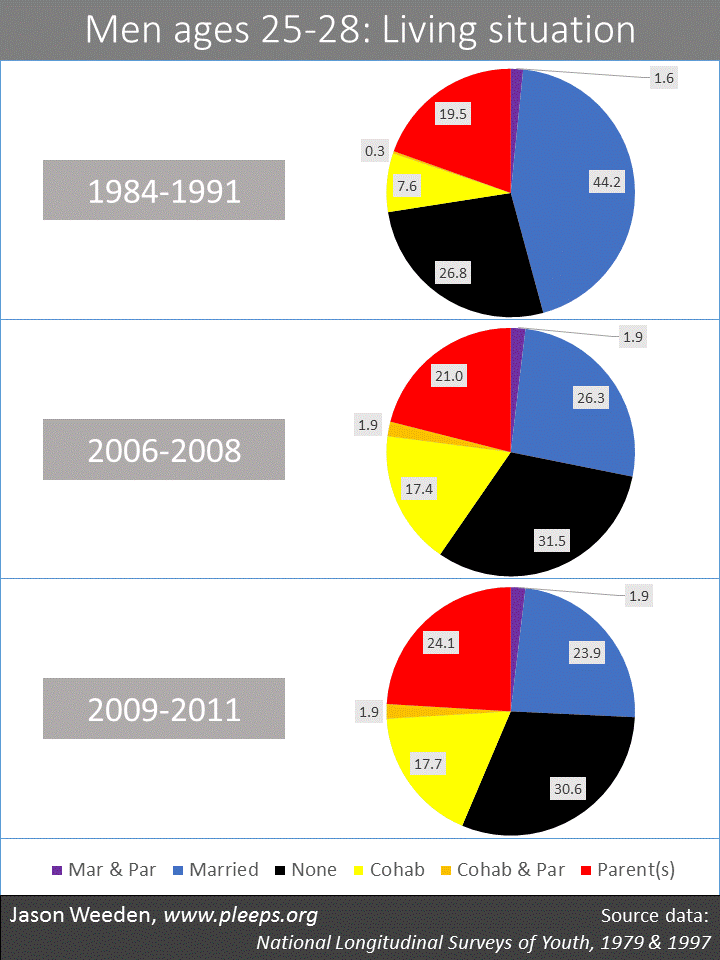
The next chart shows living situations—whether they were married, cohabiting, and/or living with parents. The orange, red, and purple wedges are men living with parents (the red wedges are the real point of interest, namely, men living with parents but not with a spouse or cohabiting partner). From the late-1980s to the pre-Great-Recession years, the total living with parents did increase from 21.4% to 24.8%, though most of this increase came not from single men but from married/cohabiting men. In fact, single men living with parents (the red wedges alone) showed only a small increase from 19.5% to 21% over this 20-year period. The big change over this period was away from marriage. But it was not from marriage to living with parents, rather it was primarily from marriage to cohabitation, and secondarily from marriage to living without parents or a partner. The increase in single men living with parents from the late-1980s to the mid-2000s was trivial.

When we compare living arrangement from the 2006-2008 period to the 2009-2011 period, we do see a bump in single men living with parents, from 21% to 24.1%. It looks like this bump is mostly coming from further declines in marriage. Again, I don’t see how we construct a technology-made-them-do-it story here, or how centrally important that story would be even if marginally true.
Getting really detailed
The real payoff of the NLSY data is that we can look directly at very detailed combinations of features. It’s too much to put in a chart, but I’ll describe some central points.
Most important, what are the numbers on the stars of the Hurst/Cowen narrative—namely, men who are not working, not in school, not married, not cohabiting, and living with their parent(s)? Prepare to be underwhelmed. For men ages 25 to 28 in the 1984 to 1991 period, the idle/uncoupled/basement-dwelling were 3.9% of the sample. In 2006 to 2008, they were 4.8% of the sample. Let’s pause here. The story is that we’ve got idle men living in their parents’ basements because of internet porn and video games. The direct look from NLSY data at pre- and post-internet (but pre-Great Recession) men shows an increase in idle basement-dwellers from 3.9% to 4.8%. Now, for the 2009 to 2011 period, the number jumps to 6.7%. Again, is there a troubling trend? Yes. Is it a new normal? Maybe, or maybe not. Is it something that deserves broad conclusions or breathless headlines? Almost surely not.
Further, the bigger gains in living with parents have come not from idle men but from men who work or are in school. Among those not working or not in school, 41% were living with parents in the 1984 to 1991 period, 39% in 2006 to 2008, and 42% in 2009 to 2011. For working men the numbers go from 19% to 22% to 24%. For men in school it’s 21% to 23% to 29%. One can cite statistics on increased living-with-parents next to statistics on idleness, but that doesn’t mean that the increase in male idleness is the main driver of increases in young men living with parents.
The NLSY data among men ages 25 to 28 indeed show a big decrease of 17 points from the late-1980s to the mid-2000s in men who were working, married, and not living with parents—from 38.7% down to 21.7%. The main offsetting increases came from men who were: working, cohabiting, and not living with parents (+7.8); idle and not with a partner or parents (+2); working and not with a partner or parents (+1.7); working, cohabiting, and living with parents (+1.3); and idle, cohabiting, and not living with parents (+1.1).
The transition from pre- to post-Great Recession resulted in a further 3-point decline in men who were working, married, and not living with parents, as well as declines among those working and not with a partner or parents (-1.5), and those working, cohabiting, and not living with parents (-1.3). The main offsets in the height of the Great Recession were from men who were idle, not partnered, and living with parents (+1.9), as well as idle, cohabiting, and not living with a parent (+1.3).
It’s a nice story, but…
There are, I think, three big things going on with these data. (1) Young people have been marrying less and later. (2) Young men have been working less and going to school more. (These two major trends interact, and result generally in a slower transition to adult patterns.) And (3) recessions suck, and great ones suck greatly.
Most of the other trends here are either small or incidental to these Big 3. Yes, a few more men are living with parents. It’s partly a small thing of its own, and also about extended educations and avoided marriages, and also about the Great Recession. Yes, a few more men are idle. It’s partly a small thing of its own, and also about declining marriage rates, and also about the Great Recession. Yes, new technology is great. It probably has an effect on reducing incentives for work and school, but not a very big one.
Like I said, I was initially inclined to be persuaded that Hurst’s thesis of idle young men was importantly true. Why is that? Mainly, I had an overblown impression of the extent of the current problem of youth idleness in comparison with prior recession periods. But it’s probably also because it’s easier for those of us in comfortable positions to look at the current struggles of many young adults and think that it’s mostly because it’s what they really want, because they like it that way, because they deserve it. The story about new technology enhancing leisure quality is fantastic for those purposes (with the added bonus of enhancing the storyteller’s feelings of moral superiority). Such stories are really easy to believe. But, you know, that’s why we check the numbers.


