Let’s start with a pop quiz. Here are two questions about total fertility rates (that is, about the rate at which women in a given population in a given year were having children, taking into account the ages of the population’s women). First question: For the years 1907, 1937, 1957, and 1967, in which of these years did American women have the highest fertility rate? Second question: In which of these years did they having the lowest fertility rate? (Thirty seconds—good luck.)
These aren’t trick questions, but they’re ridiculously hard. I’m not sure that even people relatively knowledgeable about fertility trends would typically get both answers right off the tops of their heads.
The answer to the highest rate question is that the Baby Boom isn’t called a Boom for nothing. The Baby Boom is generally measured as running from 1946 to 1964. And peak Boom was from 1956 to 1960, when the total fertility rate was about 3.6. (A total fertility rate of 3.6 in a given year means that, if a woman over the course of her life had children at the rate that women on average were having children that year—if she had as many in her 20s as women in their 20s had that year on average, and as many in her 30s as women in their 30s had that year on average, etc.—she would end up giving birth to 3.6 children total.) The Baby Boom was an astounding time period. You have to go back to the 1800s to find higher American total fertility rates than those of peak Boom.
The answer to the lowest rate question is that the Great Depression isn’t called Great for nothing. I suspect that lots of people would have guessed that fertility rates were lower in 1967 than in 1937. After all, the pill came on the market in 1960 and by 1965 became the most used form of birth control. With such a strong tool at their disposal, surely American women in 1967 would have fewer children than those pill-less primitives of the 1930s. But it wasn’t even close. The total fertility rate was around 2.5 in 1967, compared with a mere 2.1 in 1937. A great depression indeed.
Way back in the day
People who think about historical fertility generally agree that the macro-story of the past two or three hundred years in (currently) developed societies is that, yes, lots of people used to have lots of kids. These were times when these societies were largely agrarian and poor, where there was little formal education and mortality rates generally (and child mortality rates specifically) were much higher. Then we see periods of transition in which these societies became industrialized and richer, formal education increased and mortality rates fell—and birth rates also fell. Which of these are causes and which are effects are matters of debate.
The point about mortality rates makes clear that it’s one thing to compare fertility rates in terms of how many babies women are giving birth to, but it’s another to compare reproductive rates in terms of how many surviving offspring women are having. So, for example, the total fertility rate in the U.S. was falling substantially from the mid-1870s to the mid-1920s—it went from around 4.5 in 1875 to around 2.8 in 1925. But this was also a time of greatly increasing child survival rates. If we adjust for child survival to age ten, the adjusted total fertility rate (i.e., how many kids a hypothetical population-typical woman would have that would survive to age ten) declines much less dramatically from around 3.1 in 1875 to 2.5 in 1925. Put another way, a woman had to have 4.5 births in 1875 to end up with 3.1 ten year olds on average, but over the next half-century this kind of gap narrowed considerably.
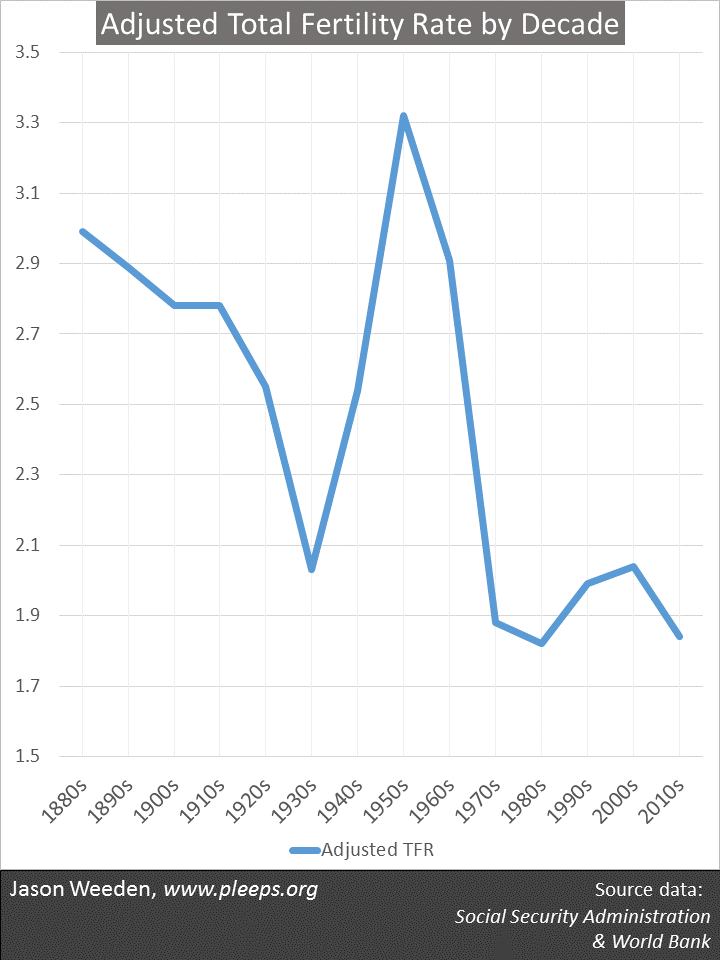
Below I show this adjusted total fertility rate (i.e., the production of ten year olds rather than the production of babies) in the U.S. for each decade from the 1880s to the first half of the 2010s. This takes the issue of child mortality off the table and lets us see something about the approximate real family sizes women were ending up with on average. Here we see the slow decline of the late-19th and early-20th century, the great plunge of the Depression years, the mind-boggling baby-mania of the 1950s, the colossal crash of the 1970s, the slight rebound of the 1990s and 2000s (which was partly due to increased immigration), and the lesser plunge of our recent Great Recession.
 (Technical note: This combines historical data from the Social Security Administration (from Chart 10 here—you can click on that chart to get a data table), updated with more recent World Bank data.)
These historical data tell a pretty complex story—a roller coaster ride with deep dips and steep climbs. But that’s just the tip of the iceberg.
Not all periods of low fertility are the same
From the chart above, 1930s fertility looks a whole lot like 2000s fertility. In both periods the adjusted total fertility rate was a bit over 2. Yet it turns out that fertility patterns in these time periods were really very different.
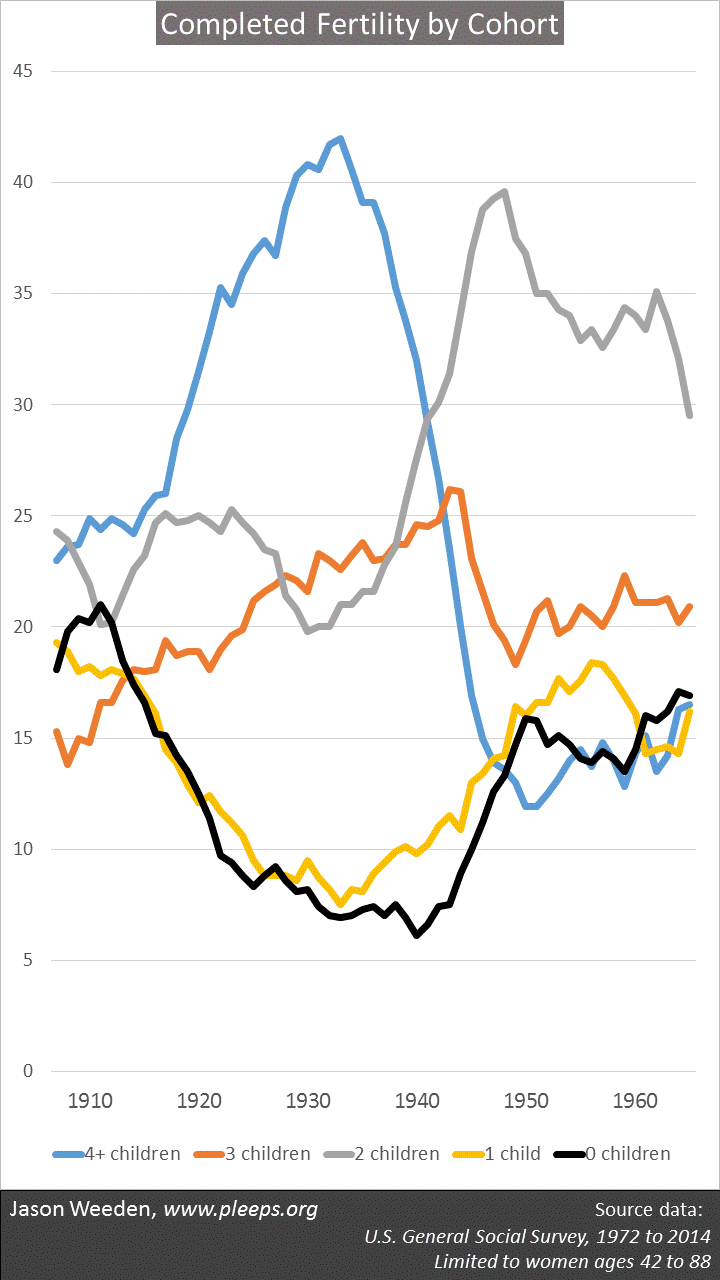
The next chart (below) is an eyeful, but worth the strain. Here, instead of thinking about how things would turn out for an average hypothetical woman, we look at how things turned out for different actual women. The bottom axis isn’t the year they were having babies, but the year in which the women were themselves born. These data show how many kids American women actually ended up having based on the women’s year of birth. It’s from General Social Survey data, which allowed me to produce reasonable estimates for women born from 1907 to 1965.
The key is that I’m showing not average fertility, but rather what percentages of women ended up giving birth to 0 (the black line), 1 (yellow), 2 (grey), 3 (orange), and 4 or more (the blue line) children. Looked at in this way, it’s clear that the average-level similarity between the 1930s and recent years masks very different patterns. The early years of this chart are mostly those women having kids (or not) in the 1930s, and, for them, it’s a feast-or-famine pattern. Relative to later women, these Depression-era women include lots of 0s and 1s and a moderately sized 4+ group, but relatively few 2s and 3s. Flash forward to women born in the 1960s, and now there are a ton of 2s, but actually fewer 0s and 1s than for Depression-era women. In between, of course, are the mothers from the Baby Boom years, mothers born mostly in the 1920s and 1930s—for them, it’s a straightforward story of high fertility as the 0s and 1s plunge and the 3s and 4-or-mores rocket up.
 (Technical notes: The total sample size is 16,820. Results are weighted. To smooth out the results, estimates for each cohort year are based on a combination of the five surrounding cohort years.)
Puzzling over low modern fertility
This post is part of a series I started yesterday on the evolutionary puzzle of low fertility in modern developed societies. Here, I want to put this modern puzzle in wider historical context.
Mainly, it’s important to understand that there isn’t just one fertility puzzle here. And there won’t be one simple answer. This isn’t about how women used to have a ton of kids and now for the first time they don’t—because of the pill, or college, or whatever. This isn’t about how there have never been many childless women and now there are. This isn’t about how people have high fertility when they’re poor and low fertility when they’re rich (or else the Baby Boom would have occurred during the Depression years).
Instead, there are lots of puzzles with their own complex pieces. High-fertility patterns in the 19th century will have different explanations compared with high-fertility patterns in the 1950s. Low-fertility patterns in the 1930s will have different explanations compared with the low-fertility patterns in the past few decades. I’m going to focus on these most recent decades in these posts. Evolutionary researchers can and should look for general themes and for developmental and psychological mechanisms that are widely applicable over human history—but the unique, complex, situation-dependent outcomes that are plainly apparent just in the past century of American fertility tell us that we must also pay close attention to context and contingencies. And the modern tools of evolutionary psychology help us to do just that. More to come.
