Changing views on income redistribution

It’s probably not surprising to learn that poorer folks have far more liberal views on income redistribution than richer folks on average. Also, I don’t think anyone would be shocked to learn that, even taking income into account, there are big racial differences in economic politics.

But some other major U.S. divisions are less well known. For example, moderate-income seniors are quite a bit less liberal on income redistribution than other members of the working/middle classes. And in perhaps the least-recognized major pattern, at higher income levels, non-Christians are a lot more liberal on economics than Christians.

Looking back a few decades, income and race (those unsurprising indicators) represent longstanding divisions in economic politics. But the divisions involving age and religion are actually new. The chart below shows trend lines from 1978 to 2014 in various groups’ support for income redistribution—whether the government should reduce income differences through taxing the wealthy and giving assistance to the poor (higher values on the chart) or whether the government should not concern itself with reducing income differences (lower values on the chart). The downward slopes represent conservative shifts and upward slopes represent liberal shifts.
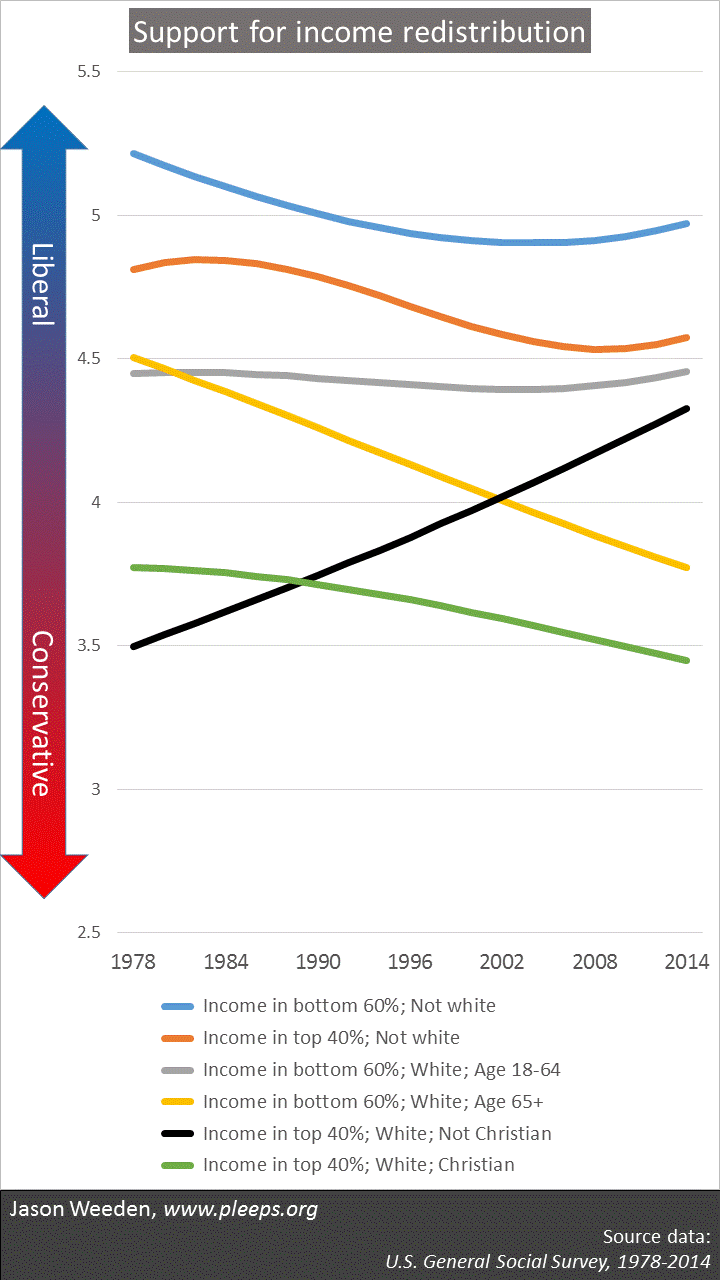
GSSNewIncRe(Technical notes: The total sample size is 31,653. Results are weighted. The opinion item is the GSS’s EQWLTH variable, reverse-coded such that 7 is the most liberal value and 1 is the most conservative. Income percentiles are based on the GSS’s inflation-adjusted family income variable. “White” means non-Hispanic white.)

It’s important to keep in mind that these data aren’t tracking specific individuals, but rather come from surveying different people at different times—thus, the folks represented by these groups in the 1980s are not necessarily the same folks in the 2010s. Over these years, some younger folks reached survey-eligible adulthood and some older folks died; many immigrated to the U.S.; some non-seniors became seniors; and so on. There’s a lot going on here. These trend lines might represent individual-level shifts or cohort replacement or both.

Changes in education, income, and race

The chart shows that lots of groups have become somewhat more conservative (i.e., lines that slope downward overall). These trends largely come from changes within these groups in education, income, and racial composition. Every group on the chart contains people with higher average education levels in the later years than in the earlier ones. Low education levels typically translate into more liberal economic views, so that’s part of the overall trend—many of these groups have become a bit more conservative on redistribution because their populations now have more education.

Also, income inequality has been on the rise—richer groups have gotten richer while poorer groups haven’t really become less poor. The key exception here is seniors, where poverty levels have declined over these years. So that’s another part of it—seniors as well as folks in higher-income groups tend to be a bit more conservative these days because they’re richer on average than they used to be.

There’s an added factor in the non-white groups (the top two lines on the chart). Their somewhat conservative trend over time relates not only to education and income, but also to the fact the earlier years primarily included blacks, but now include large proportions of Hispanics and Asians. Blacks have been more liberal than Hispanics and Asians on economic items throughout the survey period, so, as the proportion of blacks decreases, the economic liberalness of non-whites as a whole declines.

These factors statistically account for the lion’s share of the conservative-sloping trends on the chart. The minor exception is the more extreme conservative trend among poorer white seniors. For them, about half of the slope is due to changes in education and poverty, but it’s not clear to me what the other half is (I checked whether it’s changes in party identification and self-labeled ideology, and that’s not it).

While changes in education, income, and race account for most of the trends seen on the chart, there’s something obvious left over—the dramatically upward-sloping black line. One of these kids is doing his own thing.

The fantastic oddity of wealthier white non-Christians

Against a backdrop of increased education and wealth and conservative-trending lines stands an unfathomable deviation: wealthier white non-Christians (mostly including non-religious folks, but also Jews, Buddhists, etc.). They stand naked in flame, First of Their Name, the Unburnt, Queen of the Liberals and the Elite Media, Khaleesi of the Great Coastal Cities, Breaker of Self-Interest, and Mother of All Political Puzzles.

Are they better educated and richer than they used to be? Yes. But still their liberalism rises. Is that just because they’re more likely now to be self-styled liberal Democrats than they used to be? That may be a bit of it, but it’s complicated—the increased leftward push of party and ideology is almost perfectly balanced against the rightward push of their increasing socioeconomic status, leading statistically to close to a 0% overall explanation of their dramatic rise in liberalism on economic issues.

I can be more specific about what’s happening, but I can’t tell you why it’s happening. It’s ideological/coalitional consistency. Over the past few decades, as the parties have sorted into liberal and conservative policy bundles, educated whites (more than other groups) have greatly increased the extent to which their views across disparate political issues line up on a single left-right axis. And the black line on the chart above is the main component of this recent pattern—namely, the sorts of people who have long been liberal on religious issues (abortion, gay rights, school prayer, etc.) have become likely to align their economic politics with their religious politics, something they didn’t used to do. There have been changes across cohorts as well as changes within cohorts.

The thing that makes it such a tough nut is that it’s an interaction between a specific group and the nature of the political times. It’s not that white non-Christians are inherently economic liberals—in the Reagan years they were as conservative in their economic views as white Christians. And it’s not that everyone these days is pretty consistently adopting the wide range of issue positions represented by their parties and ideologies—it may sometimes seem that way, but it’s just really not true of large swaths of the general public. Instead, it’s something about how this group is responding to these times. And I’m not sure what that something is.

Still waters run deep

If we look at support for income redistribution among the public as a whole, there’s no straight trend across the past few decades—there have pretty consistently been somewhat more liberals than conservatives. But the chart above is a good reminder of how much can be happening beneath a smooth surface. It’s not just that there are big demographic fissures in public opinion, but the fault lines can vary over time.

That’s part of what makes social science so hard. It’s like trying to solve a big crossword puzzle that’s constantly evolving into a different puzzle—where some of the clues and required answers change even as you’re trying to fill them in.

Who thinks corporations are too rich and the poor should get more?

Bernie Sanders tells his supporters that wealthy corporations must pay their fair share. Orrin Hatch tells the U.S. Chamber of Commerce that Obama’s agenda is class warfare. Where does the public land? The answer has a lot to do with income, age, religion, race, and gender.

Here, I look at two items from the Pew political surveys. One asks for a choice between two statements on government benefits and the poor: (1) Poor people have hard lives because government benefits don’t go far enough to help them live decently; (2) Poor people today have it easy because they can get government benefits without doing anything in return. The other asks for a choice between two statements on corporations: (1) Business corporations make too much profit; (2) Most corporations make a fair and reasonable amount of profit.

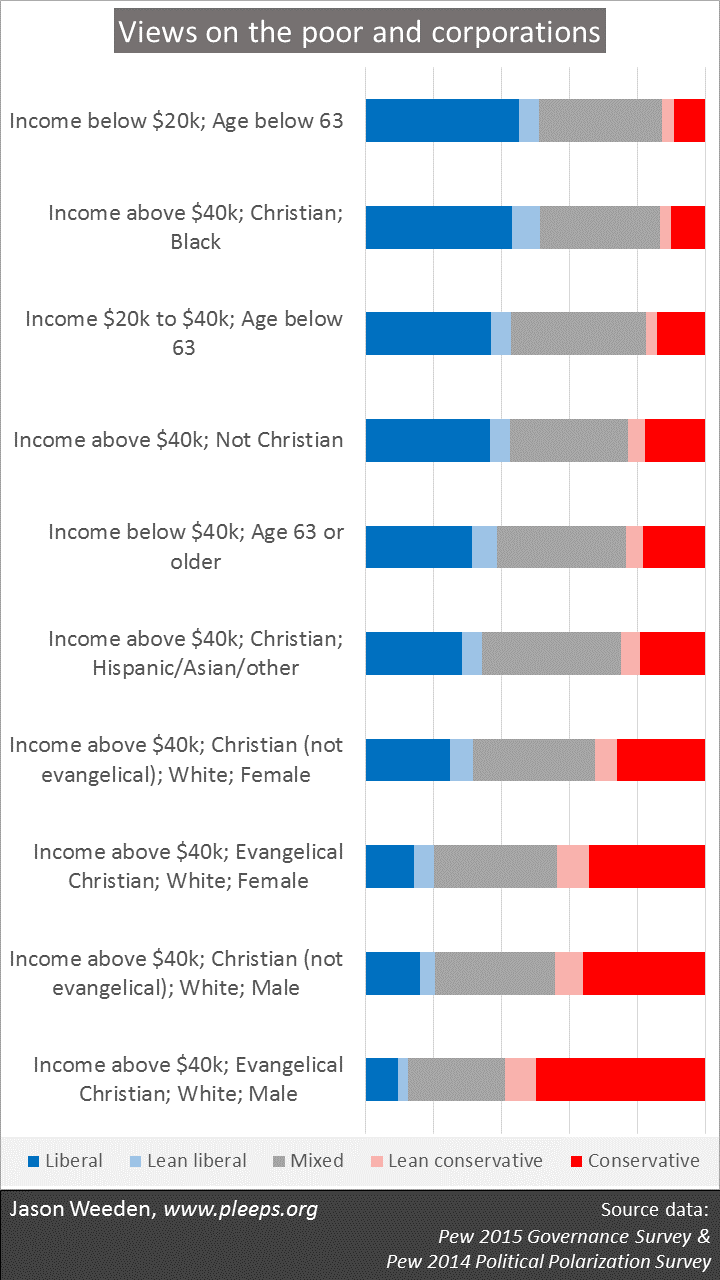
I combined the answers to the two questions are went looking for the big differences in group positions based on demographics. The first big split was, perhaps unsurprisingly, on income—people with below $40,000 in annual income are substantially more liberal on average than people with higher incomes. Then I took those two groups, found the next-biggest splits, and kept going with the biggest splits in the biggest sub-groups until I ended up with the 10 below—shown from most liberal to most conservative.

PewPoorCorp(Technical notes: The total sample size is 16,017. Responses are weighted. “Liberal” means people who selected the liberal response on both items (and the reverse for “conservative”), the “mixed” folks went one way on one and the other on the other (or had no opinion on either), and the “leans” are smaller categories where people answered one item but were neutral on the other. “Evangelical” means “born again or evangelical” or Mormon. “White” is non-Hispanic white.)

As I said, the initial split was income over/under $40,000. There are a lot more liberals than conservatives in the under-$40k camp, particularly for those under $20k. But the numbers are closer when they’re seniors. The not-as-liberalness of lower-income seniors comes, I suspect, from two sources. First, knowing that someone’s annual income isn’t very high just isn’t as meaningful information when you’re getting it mostly from retired people. And second, seniors have their own—rather generous (relative to other U.S. government programs)—set of support programs (primarily Social Security, Supplemental Security Income, and Medicare), programs that are in budgetary competition with programs for the non-elderly poor. (Given their Sanders skew, one might have expected to find young people as especially liberal on these rich-poor items. But, as I’ve discussed, it’s just not the case that Millennials are particularly liberal on these kinds of economic items.)

Among those with incomes above $40,000, the big splits involve religion, race, and gender. Blacks and non-Christians are basically as liberal as the under-$40k folks. Hispanic/Asian/other Christians and non-evangelical white women are more evenly split. Evangelical white women and non-evangelical white men are pretty conservative on the whole. And the group in which conservatives most greatly outnumber liberals (by over 4 to 1) is evangelical white men.

As I’ve discussed elsewhere, there are various practical matters that help make sense of these opinion patterns. Some aspects involve short-term self-interest (e.g., why the non-senior poor tend to favor assistance to the non-senior poor). Some aspects relate to who has higher likelihoods of needing hard-times assistance at some point (e.g., race and gender). Some aspects relate to who has better and worse access to non-government support from social networks and charities (e.g., race and religion).

But it’s also clear that there are elements of political coalitioning here as well. Mainly, I don’t see a way to make sense of the remarkable extent of the economic liberalism of wealthier non-Christians without some notion that these are ideological or coalitional sympathies. The irony here is that these are some of the folks who—what’s the matter with Kansas?—are often dismayed that poorer whites are insufficiently supporting their own self-interest. Yet it’s really wealthier non-Christians who tend to be the biggest self-interest outliers on economic issues.

Are the college educated less religious?

I suspect that lots of people believe that college-educated Americans are less religious than others. The secular left sometimes views religion as a product of ignorance, expecting those with more education to be better able to break religion’s spell. The religious right sometimes agrees that there’s a link between higher education and reduced religiosity, but views it as a matter of brainwashing rather than spell-breaking—part of the professorial cabal’s secular indoctrination agenda.

But is it true that the college educated are less religious? Well, it depends on what measures we’re looking at.

If we focus on belief in God, there are real educational differences, with the college educated relatively more likely to be atheists, agnostics, or doubting believers. If we focus on the “born again or evangelical” distinction—or related areas like biblical literalism—the college educated are also less religious in the limited sense that their religious preferences are less evangelical or absolutist.

However, if we focus on how frequently people attend religious services, now the college educated don’t differ from the less educated in religiosity. As I’ve covered in previous posts, church attendance is mostly about restricted/unrestricted sexual lifestyles rather than education.

There’s also the matter of Christian vs. non-Christian religions. In particular, Jewish and Asian Americans (including lots of Buddhists, Hindus, etc.) are unusually likely to be college educated, contributing to higher percentages of non-Christians at higher education levels.

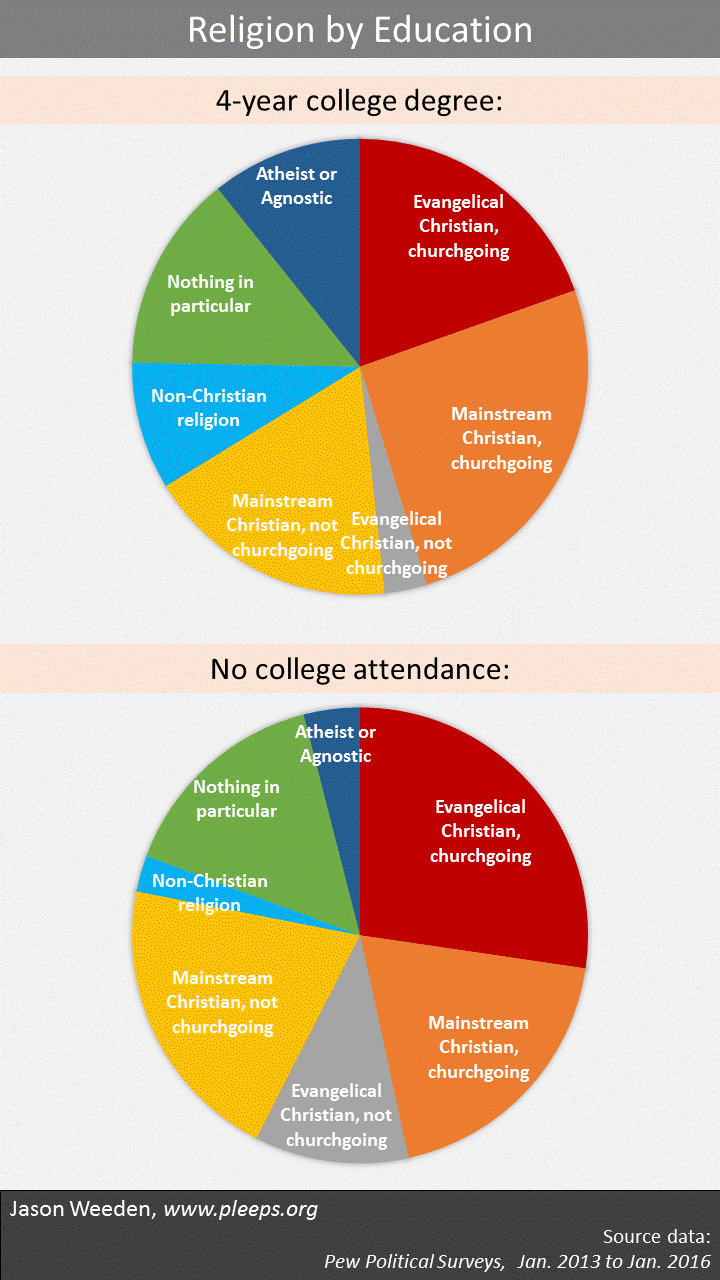
So there’s a lot going on here. Relative to non-college folks, the college educated are more likely to be atheists, agnostics, Jews, Buddhists, Hindus, etc., and less likely to be evangelical Christians, but equally likely to go to church. The Pew datasets provide a good opportunity to see all these things happening at once. In the charts below I show the basic religious breakdown for people with 4-year college degrees and for people with no college attendance. (To save space, I’m not showing the middle group, people with some college but not 4-year degrees, but, as one would expect, they’re in between the patterns of the two groups I show.)

PewRelEd(Technical notes: The charts exclude people with missing religion information, <1% of the sample. The 4-year-degree group has 23,675 individuals and the non-college group has 17,953. Results are weighted. “Churchgoing” here means they report going to church “once or twice a month” or more. “Evangelical” means they indicated they’re “born again or evangelical” and “Mainstream” means they did not.)

If there’s a general theme, it’s not the simple more/less one. Instead, it’s that the college educated are religiously diverse and polarized. There are relatively more non-traditional, non-Christian identities among the college crowd, but also a polarized tendency to be religious when religious and unreligious when unreligious. That is, lots in the non-college camp maintain a Christian label when they’re non-observant (something I suspect has to do with operating in social groups that tend more towards group-based discrimination, and wanting to be on the dominant side). The college educated are less likely to occupy this middle ground. Relative to non-college folks, when they have a religious identity they’re more often attending services, and when they don’t they’re more likely to move from the generic “nothing in particular” camp to the more declarative “atheist” and “agnostic” identities.

Which Christians are “born again or evangelical”?

Currently, religious identities are among the most potent predictors of political views. This is particularly true for issues with explicit religious content (e.g., school prayer) and for sexual and reproductive issues (e.g., abortion), but has recently become increasingly true as well across the full spectrum of partisan issues—the environment, immigration, race, income redistribution, and so on.

Often the key contrast is between non-Christians on the left and born-again/evangelical Christians on the right. This split interacts to varying degrees with race and education such that the far right is often inhabited by white evangelicals and the far left by college-educated non-Christians.

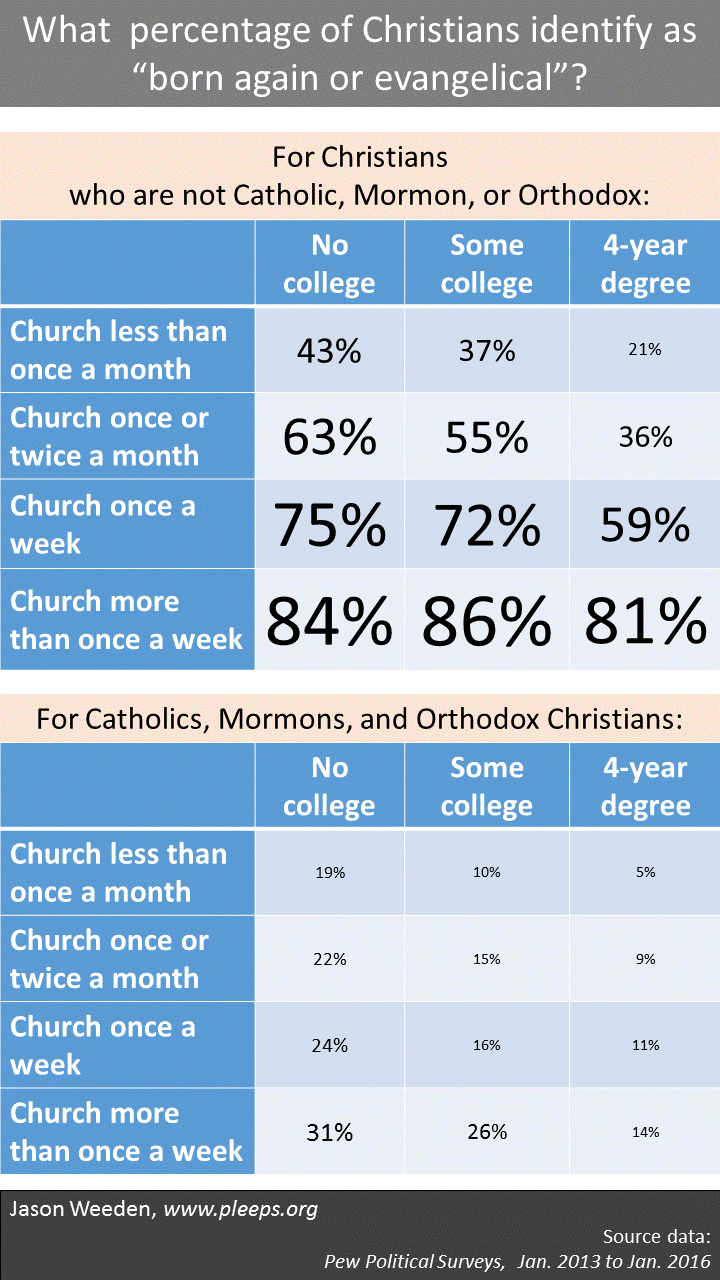
When thinking about the “born again or evangelical” distinction within Christians, it’s important to understand the basics of when Christians tend to use those labels and when they don’t. In particular, self-identified born-again/evangelical Christians are much more likely to be found among Protestants and generically identified Christians than among Catholics, Mormons, and Orthodox Christians, and also much more common among frequent churchgoers and the less educated. The tables below give the basic numbers.

PewBAE(Technical note: The total sample here consists of 42,291 Christians.)

So, for Protestants and generic Christians who go to church more than once a week, over 80% identify as born-again/evangelical. Move away from these super-attenders, and the numbers vary greatly by education. Among those who go to church less than once a month, for example, 43% of those who haven’t gone to college identify as born-again/evangelical, compared with only 21% of those with 4-year degrees.

Among Catholics, Mormons, and Orthodox Christians, relatively few identify as born-again/evangelical, though it still varies greatly by church attendance and education. Very frequent churchgoers with no college attendance? 31%. Infrequent churchgoers with 4-year degrees? 5%.

Thus, a major part of the potency of the “born again or evangelical” designation as a political predictor is that it lumps together a lot of salient political information—on religious denomination, on frequency of church attendance, and on education—all in one tidy variable.

I also suspect that its use and nonuse serves, in part, as a kind of social indicator for political views. That is, it’s in part a way of quickly summarizing for others one’s positions on religiously salient issues like abortion and gay marriage, acting as a kind of domain-specific liberal/conservative label. Because of that, I’m sometimes reluctant to use it as a political issue predictor. The possibility that it’s a post hoc label for certain political views makes it less interesting when one is trying to get at the root causes of those political views.

In fact, one can typically use denomination and church attendance and education as a longer road to more-or-less the same predictive outcome as the “born again or evangelical” designation. Using “born again or evangelical” as a predictive variable is probably not a real problem, though, so long as one is cognizant of its wider demographic significance. See “evangelical”; think “mostly Protestants and generic Christians with high church attendance and/or less education.”

The mystery of Millennial politics

Millennials are politically weird. If it were just that they’re generally more liberal than older folks, that wouldn’t be weird. In fact, that might be a reasonable thing to expect from a racially diverse and less religious group that has been unduly punished by the Great Recession. But the weirdness comes in the detailed pattern of their liberalism—in the issues on which the do (and do not) show unusual liberal tendencies. This pattern, as far as I can tell, is genuinely new and remains almost wholly unexplained.

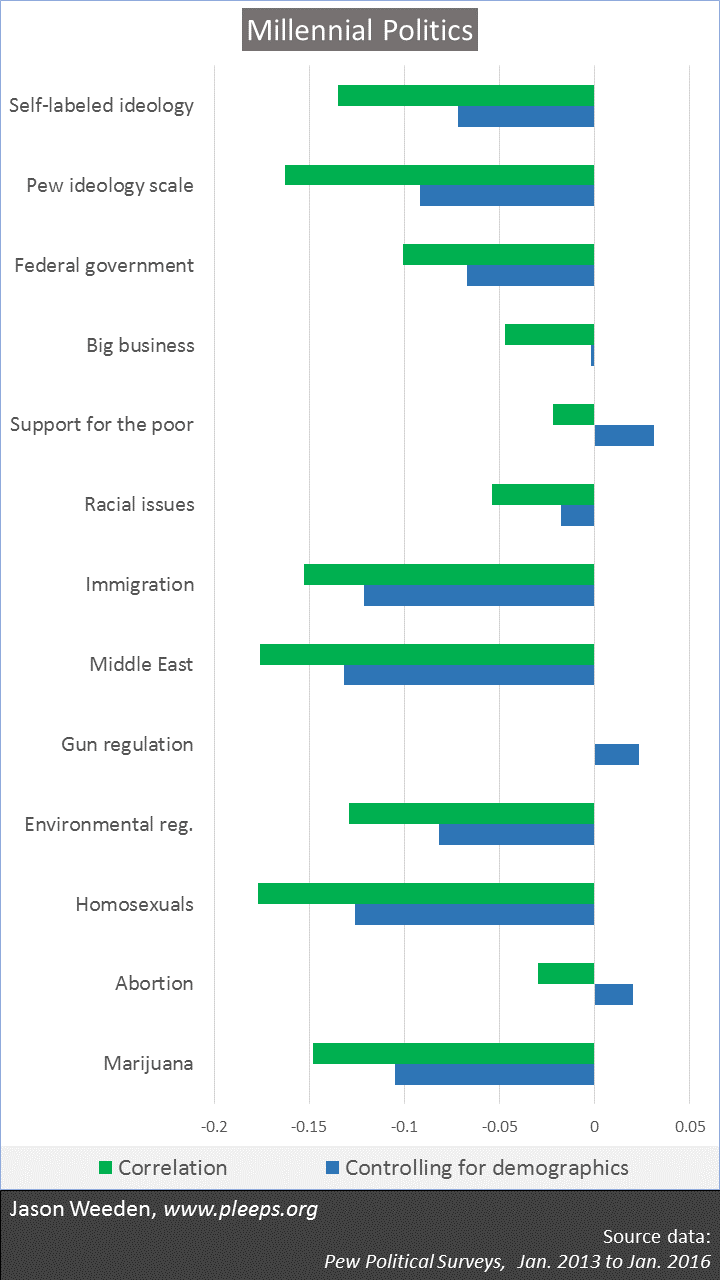
First I’ll show the pattern. Then I’ll talk about it, though it’ll mostly be about how the usual ideas fail to make sense of it. The chart below shows the extent to which Millennials are more liberal (bars to the left) or occasionally slightly more conservative (bars to the right) on ideology measures and on specific issues in public opinion. The green bars show simple correlations—without taking anything else into consideration, to what extent are Millennials different from the rest of the public? The blue bars show what’s left over in these correlations when the statistical model also takes into account standard demographics such as race, immigrant status, religion, education, and income—to what extent are Millennials different from the rest of the public after taking standard demographics into account?

PewSlide62316(Technical note: I created the various issue measures by combining a number of individual items from the Pew political surveys. Only the self-labelled ideology measure has been asked consistently (N = 57,719). The number of individuals included for issue-based measures varies from 11,502 to 34,172. So, yeah, these are pretty good numbers.)

Here’s the deal. Millennials are more liberal on general ideology measures. But their liberalism is specifically concentrated in a particular set of issues: Homosexuals (e.g., items on same-sex marriage and whether homosexuality should be accepted or discouraged), Middle East (i.e., opinions about use of military force and various conflicts in Middle East), Immigration, Marijuana legalization, Environmental regulation (e.g., whether stricter environmental laws are worth the cost), and general attitudes towards the Federal government (e.g., whether they trust the government and think the government generally does a good job).

But their liberalism on these issue items ends there. Millennials are only marginally or no more liberal than older folks when it comes to Big business (e.g., whether corporations make too much profit or whether the economic system unfairly favors powerful interests), Support for the poor (e.g., whether government aid to the poor is a good idea), Racial issues (e.g., whether the U.S. needs to continue making changes to give blacks equal rights), Gun regulation, and Abortion rights.

All the obvious theories fall apart. Has Obama led them to be pervasively liberal? No. Are they pervasively “social” or “cultural” liberals? No. Are they anti-discrimination liberals? Yes on gays and immigrants; no on blacks. Are they secular lifestyle liberals? Yes on gays and pot; no on abortion. Have their experiences in the Great Recession led to an unusually leftward tilt on rich-poor issues? Really no. Is their liberalism a statistical side-effect of the fact that they contain higher proportions of minority, immigrant, non-religious, or economically struggling folks? That’s part of it (i.e., the blue bars in the chart are generally shorter than the green bars) but clearly not the whole story.

Millennial liberalism isn’t their parents’ liberalism. I’m not sure what it is. It’s something new.

But aren’t all the kids big Sanders supporters?

There is a mythology that has developed in the wake of the widely reported Millennial support for Bernie Sanders. Because Sanders’ supporters were so young on average, it created the mistaken impression that the large majority of Millennials align with Sanders-style democratic socialism. That’s not true.

In fact, as far as I can tell, most Millennials who voted in the 2016 primaries and caucuses didn’t vote for Sanders. If you think that sounds crazy, you’re forgetting that, in addition to the Clinton-Sanders race, the Republicans had contests as well. My back-of-the-envelope calculation is that Sanders got the support of about 3.5 million voters under 30 to Clinton’s 1.5 million (a blowout, to be sure), but there were also around 3 million voters under 30 on the Republican side. So, sure, Millennials are more likely to be Democratic rather than Republican voters, and way more Millennials voted for Sanders over Clinton on the Democratic side, but that doesn’t equate into a landslide majority of Millennial primary voters favoring Sanders. And even this leaves out the roughly 60 million eligible Millennials who didn’t vote in the nominating contests.

Further, the general picture of Millennial politics in the chart above shows that two of the key components of socialist support and opposition—views on big business and assistance for the poor—are among the issues on which Millennials are really not more liberal than older folks, particularly once basic demographic features are taken into account.

Someday we will figure it out, but this is not that day

It’s important to keep in mind that while there is a unique Millennial pattern, it doesn’t replace the old divides. Millennials have the same powerful internal racial and religious divisions as their elders, such that, for example, white evangelicals are especially conservative while educated non-Christians are especially liberal. Yet the Millennial pattern does suggests something about how prior generations had their defining fights—Vietnam, civil rights for African Americans, communism, abortion, guns—and now Millennials have theirs—the war on terror, gay rights, immigration, climate change, marijuana legalization. There might be something there that helps make sense of Millennial politics, something about how the particular issues that are on the move in one’s youth can create a kind of unique generational seasoning to old stew. Or it might be something in the air generally blowing Americans to the left on Millennial issues, and it’s just that the young—who haven’t yet developed weighty partisan anchors—get pushed farther and faster than others. Or it might be something else entirely.

A defensible answer, I think, will have to wait. Mainly, we need to get a better look at how things unfold over time. Right now, it’s the youngest of the young-adults who are showing the most robust (but selective) liberal skew. It really could be temporary—some trendy adornment of youth destined for a dusty attic box. But it also really could stick, signaling (perhaps not fundamental but still significant) shifts in the landscape of public opinion.

The demographics of views on immigration and Islam

People talk about dog whistles in politics, but recently the whistles have been replaced with fox-hunting trumpets. Donald Trump’s small horns call Fox-hunters to the chase with bleats and tweets of marauding immigrants and malevolent Muslims.

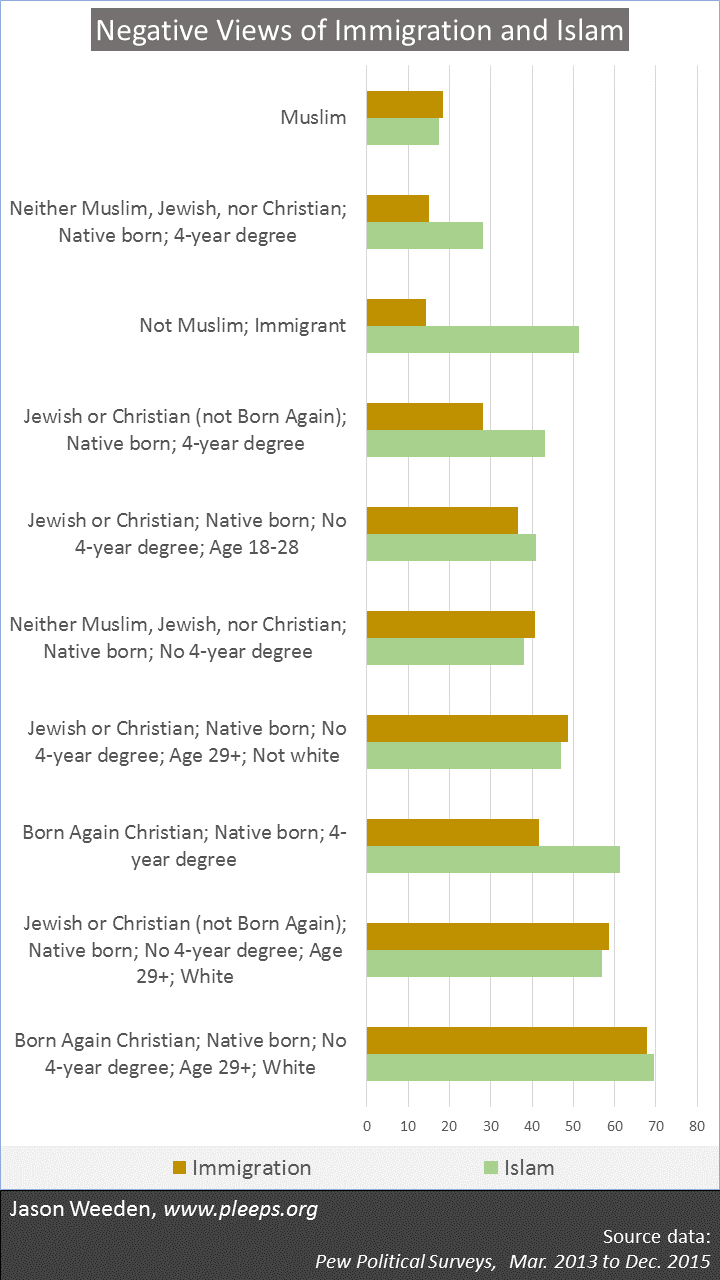
What kinds of folks are likely to find these positions appealing or not? Here, I look at the demographic predictors of two opinion items that have been asked in some of Pew Research Center’s political surveys (available online). One item measures opinions on whether immigrants strengthen or are a burden on the U.S., and the other on whether Islam is more likely than other religions to encourage violence. Here are the results of my analysis, with the fuller explanation down below.

PewSlide62216b(Technical note: The percentages in the chart combine those who selected the negative response option plus half of those who declined to choose an option.)

To find the demographic splits in the items on immigration and Islam, I made the a priori choice to first split out Muslims and then non-Muslim immigrants. Then I started splitting the sub-groups, finding the biggest demographic predictor in the biggest remaining subgroup, making a further split, and repeating that process until I arrived at the 10 groups shown in the chart. The groups are ordered from the most positive combined views on immigration and Islam up top to the most negative views at the bottom.

Unsurprisingly, Muslims (the first group on the chart) have the least negative views on Islam. They’re also really positive about immigration on average, no doubt related to the fact that lots are from immigrant families. Take the exact numbers on Muslims with a grain of salt, though, as they’re based on a really small sub-sample (Muslims are only around 1% of the U.S. population). Also unsurprisingly, non-Muslim immigrants (third on the chart) don’t often have negative views on immigration, though, on the whole, they’re neither more nor less negative on Islam than native-born non-Muslims.

Beyond Muslims and immigrants, the demographic group with the least negative views on immigration and Islam are our old friends that I discussed in earlier posts this week—people who aren’t Christian (and, in this case, also aren’t Jewish or Muslim) and who have 4-year college degrees (second on the chart). As we’ve seen, these folks are often pretty consistently liberal. Here, they’re more favorable about Islam than any group but Muslims, and about as pro-immigration as immigrants themselves. Golly.

The most negative views involve (the last group on the chart) white born-again/evangelical Christians who are ages 29+ and who don’t have college degrees. Around 70% think Islam is an especially violent religion and close to the same percentage think that immigrants are a burden on the country. Second from the bottom are non-young and non-degreed Jews and non-evangelical Christians (including lots of Catholics, mainstream Protestants, etc.), where negative views are held by 55% to 60%.

The other groups are somewhere in between. In general, more negative views are held by those with less education, evangelical Christians, middle-aged and older folks, and whites.

Shifting Party Coalitions

Do these issues provide a road-map to Trump voters—less-educated, evangelical, older whites? Well, it really is quite close to Trump’s sweet-spot in election polls so far. But in thinking through whether those with positive/negative views on immigrants and Islam are likely to oppose/support Trump, one needs to keep in mind that there are other key issues at stake in the race. For example, lots of native-born Black Christians have negative views on immigrants and Islam, but very few are going to be convinced to vote for Trump—the Democratic party represents other positions (particularly on race and poverty) that they tend to care more about. (Similarly, lots of churchgoing African Americans are pro-life, yet the overwhelming majority still vote for Democrats.) There are also plenty of pro-immigration Republicans who will end up voting for Trump on the gamble that he (more than Clinton) will advance their preferences regarding tax-and-spend policies or Supreme Court appointments.

But we are seeing a subtle shift in the party coalitions. In fact, demographic/issue shifts in the parties are happening pretty much all the time. This latest shift is in large part an extension of previous ones, as Republicans attracted white religious conservatives in the 1980s followed by anti-immigrant conservatives in the 1990s and 2000s. In line with these shifts, the center of educational gravity within the Republican coalition has been sinking—something that has created increased space for discriminatory views within that party.

Kurzban and I mentioned all this in The Hidden Agenda of the Political Mind when covering the core demographic group in the Republican coalition—white, heterosexual, Christian, churchgoing men with higher levels of education (or “human capital”) and income—a group we referred to as “Boehners” (named after the former Speaker of the House). There, we wrote (p. 169): “Indeed, if Boehners with the highest levels of human capital continue to leak into the Democratic coalition, as they have in the past few decades, one can only wonder what other effects this might have. … Would their absence from the Republican party lead to increased Republican conservatism on group-based barriers? Only time will tell.”

It hasn’t been very long since we wrote those words, and—with the new Republican standard-bearer bumptiously trumpeting his calls for big, beautiful barriers—time already seems to be telling.

Ideological extremes and countertrends

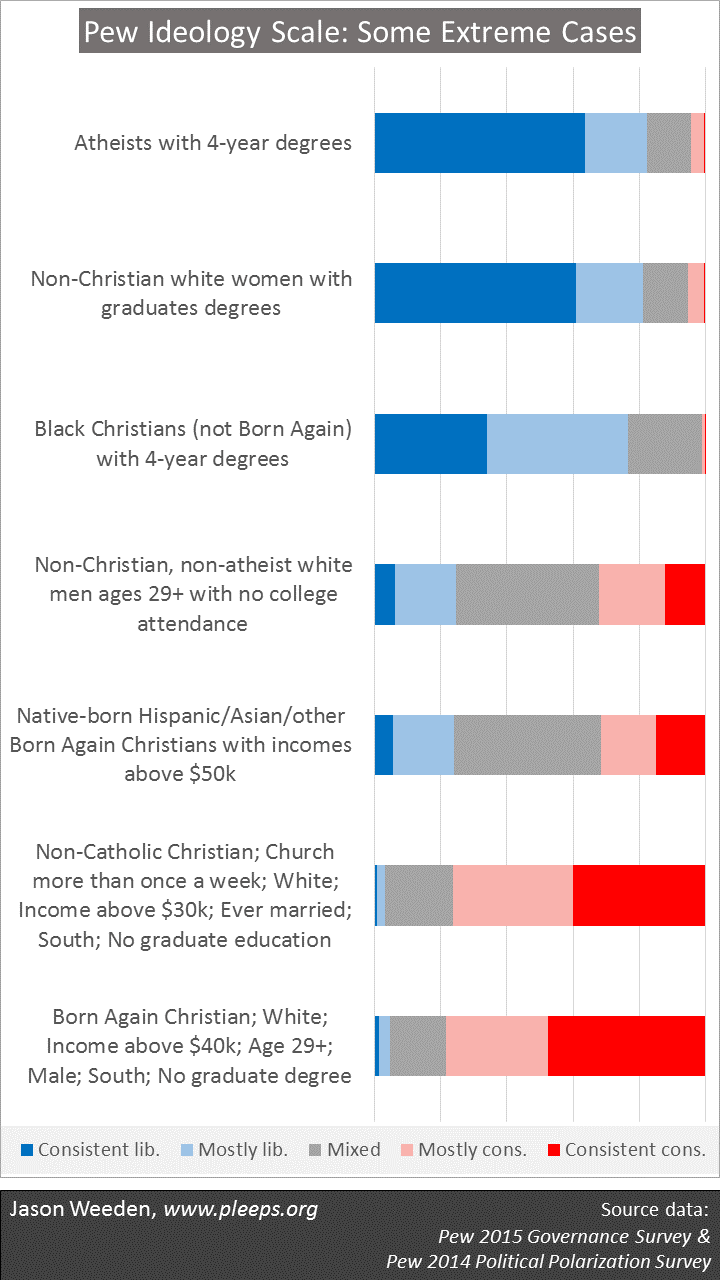
Yesterday I posted about Pew’s political data and their 10-item issue-based ideology measure, splitting the entire sample into mutually exclusive sub-groups to show the major demographic patterns. Today, I push the data: Where are the extremes and countertrends?

In yesterday’s effort, I split a roughly 16,000 person sample into 9 sub-groups. That was a really safe exercise. Today I look at smaller slices of the sample—typically around 200 or 300 people per group. So, take it with a grain of salt, folks. The margins of error in yesterday’s results were narrow; today they’re wider. The results are in the chart below.

PewSlide62116

Yesterday, the most liberal group was non-Christians with 4-year degrees, while the most conservative group was white born-again/evangelical Christians with incomes above $40,000. Within these groups, where are the extremes? The results are the top and bottom groups in the chart. Limit the non-Christians with 4-year degrees to atheists with 4-year degrees, and the result is a flabbergastingly liberal group. On Pew’s 10-issue measure, the typical college-educated atheist chooses the liberal side on at least 9 of the 10 items. On the conservative side, take those white born-again/evangelical Christians with incomes above $40,000, then get rid of the young folks, women, non-Southerners, and those with graduate degrees, and the small group remaining is almost as conservative as educated atheists are liberal.

I also tried a couple of alternate searches for super-liberals and super-conservatives. If we don’t allow the atheist distinction, there’s still a ridiculously liberal group (second on the chart) to be found in non-Christian white women with graduate degrees. On the conservative side, even ignoring the self-claimed “born again or evangelical” distinction, we can still reach practically the same level of super-conservatism by looking at (second from the bottom on the chart) white non-Catholic Christians who go to church more than once a week and are non-poor, have been married at some point, live in the South, and haven’t been to grad school.

I also searched for some countertrends. Christians are usually pretty conservative, but where can we find Christians with especially liberal political views? A quite liberal group includes Black Christians who don’t identify as “born again or evangelical” and who have 4-year college degrees (third on the chart). Non-Christians are usually quite liberal, but where are some of the least liberal non-Christians? A good combination here involves non-atheist white men who are past their 20s and have never been to college (fourth on the chart).

Where are some of the least liberal non-whites? Check out (fifth on the chart) native-born Hispanics and Asians who are born again/evangelical Christians with incomes above $50,000—they’re not nearly as conservative as their white (non-Hispanic) analogues, but pretty not-so-liberal for a non-white group. (On that last point, we found something similar using General Social Survey data in The Hidden Agenda of the Political Mind (p. 158): “One can find Latino conservatives—the best places to look are among heterosexual, churchgoing Protestants with middle-of-the-road educations and high incomes, and whose families have not recently immigrated.”)

A final note on ideological extremes. I’ve pointed out (e.g., here) that the Christian/non-Christian divide is becoming a pervasively big deal across all sorts of political issues, particularly for college-educated whites. You can really see that in yesterday’s and today’s results. It’s not-at-all mysterious to me that people (like atheists) who are really disliked by much of the public would worry about discrimination and thus be super-liberal on issues relating to discrimination against themselves. But why have they recently moved to being liberal on everything? Why the move on tax-and-spend issues, for example? Other big Democratic groups haven’t moved into practically all-liberal positions. Black Christians haven’t (though, as we just saw, the college-educated who aren’t born-again/evangelical are getting closer). Union members haven’t. Why are non-Christian whites with college educations currently so keen to adopt almost all the positions of their Democratic coalition partners when there are so few examples of other demographic groups that do the same? Is it that everyone tends to adopt their coalition partners’ views, but that some folks’ relative lack of political information gets in the way of knowing what range of positions to adopt? Is ideological alignment just lip service, such that when push comes to shove, e.g., rich atheists wouldn’t really favor robust income redistribution? I really don’t know.

The demographics of liberals and conservatives

The fine folks at the Pew Research Center have been posting their data online. For anybody. For free. Holy schnikes. For people like me who used to sit around waiting for a couple thousand new General Social Survey (GSS) respondents every two years, it’s stunning. I downloaded all the Pew political surveys just from January 2013 to January 2016 (the latest available), and it totals 58,551 respondents. This 3-year batch from Pew is basically the same size as the entire 43-year GSS dataset. I would try to put into words how I feel about samples this large, but I would collapse into joyful blubbering.

So now I’m playing with that data. For this post, I’ll look at how demographics (race, religion, etc.) predict the 10-item Pew Ideological Consistency Scale. Recently, they asked the full scale to around 10,000 people in 2014 and to another roughly 6,000 people in 2015. (Bring on the joyful blubbering.)

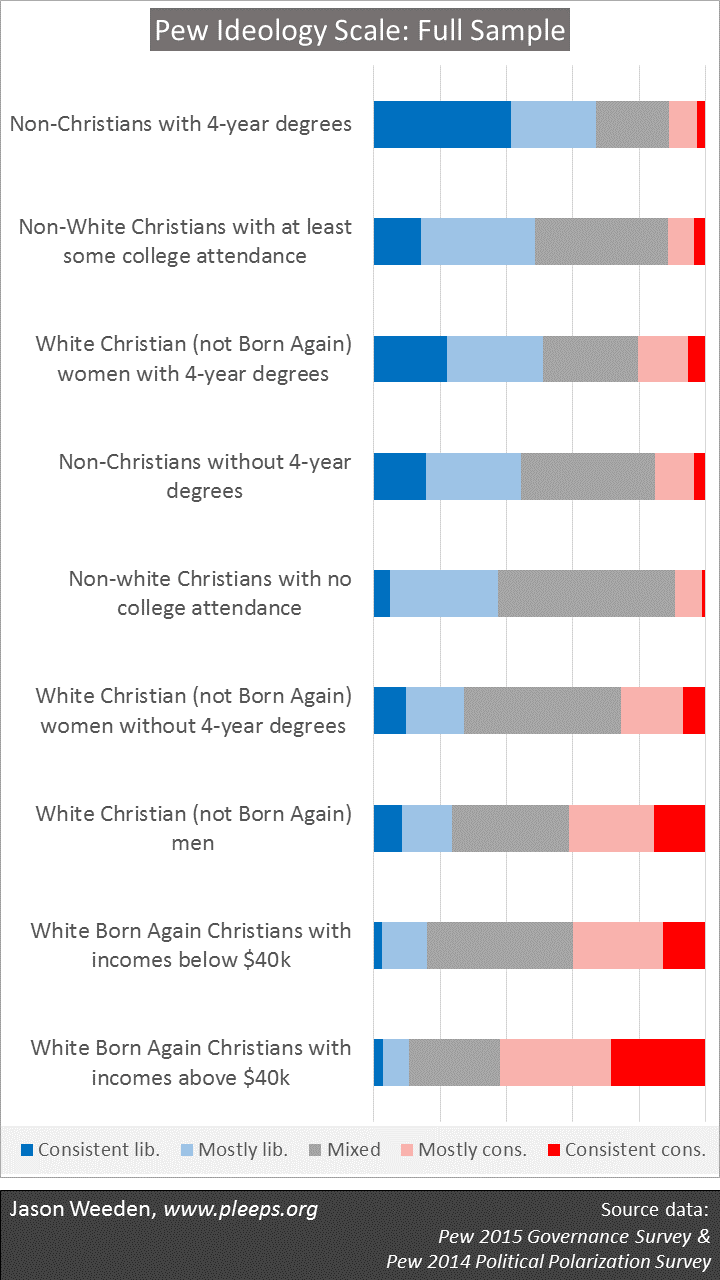
I’ll explain everything below, but for those impatient to see the results, here they are:

PewSlide1(A few terminological notes. By “white” I mean non-Hispanic white. “Born Again” means the respondents described themselves as either (1) “born again or evangelical Christian” or (2) Mormon. “Non-Christian” includes everything not expressly Christian (Jewish, Buddhist, “Nothing in particular,” etc.). “Income” is total family income in the prior year. I’m using Pew’s definitions of “consistent,” “mostly,” and “mixed” in the ideological categories.)

The Pew ideology scale is pretty good as a measure of overall issue-oriented left-right position. There are big-government items, rich-poor items, and single items on race, immigration, military force, the environment, and homosexuality (here’s a link to the exact questions). Its main weakness is that it’s light on items that correlate strongly with church attendance (e.g., abortion, marijuana, premarital sex)—it includes only one (on homosexuality). When people label themselves as “liberal” or “conservative,” it’s often as much about these lifestyle/church items as anything else. (A tell-tale sign here is that if you predict self-labelled ideology in the Pew data using the issue-based ideology scale as a predictor, there’s still a nice-sized chunk of variance left over for church attendance.) But, like I said, it’s a pretty good measure on the whole.

Here, I took the 10-item Pew ideology scale and started predicting it based on a large set of available demographic items (actually, I was predicting two things: left-right positions and consistent-inconsistent positions). Basically, it’s: Find the biggest predictor and split the sample on that predictor; now find the biggest predictor in each of those two sub-groups and split again; keep going with the biggest predictors in the biggest sub-groups until you’ve got an interesting number of sub-groups.

The chart above shows nine major demographic sub-groups when it comes to the Pew ideology scale. The sub-groups are mutually exclusive and encompass the entire sample. For those who’ve read The Hidden Agenda of the Political Mind, three of the key themes driving these results will be familiar: The biggest current demographic deals in American politics are race and religion; the overwhelming majority of folks mix-and-match conservative and liberal positions on particular issues; and college-educated whites have become especially likely to align their particular positions on a single left-right axis (though plenty still mix-and-match).

The chart is ordered from the most liberal demographic group up top to the most conservative group at the bottom. So, for example—based just on a mechanical, algorithmic splitting of the sample—the most liberal three groups match the demographic profiles of Bernie Sanders, Barack Obama, and Hillary Clinton, respectively. In general, the most liberal profiles tend to come from college-educated folks who might reasonably worry about traditional discrimination (because of, for example, religion, race, or gender). The conservative side is mostly white Christians, especially when Born Again, non-poor, and/or male. These are people who tend to benefit from the current conservative alignment of pro-discrimination, pro-wealth, and restrictive lifestyle policy positions.

While left-right clumping is interesting, deeper insights come at the level of particular issues. For example, if you want to know why lower-income white Born Again Christians are less likely to be consistently conservative on Pew’s scale than higher-income ones, it’s largely because the poorer ones are more likely to have liberal responses specifically on economic items (e.g., involving government support for the poor).

I’ll probably do a number of posts using Pew data, mostly focused on how particular issue positions relate to demographics. There are several really good issue items scattered throughout the surveys. On demographics, the Pew data lack the GSS’s super-cool life-history information (number of past sex partners, number of children, history of divorce, etc.), but have significant strengths as well (including good religion measures).

[Update: Here’s a guide to other recent posts of mine, many on political demographics.]

Self-interest, politics, evolution, and genes

In our book, The Hidden Agenda of the Political Mind, Kurzban and I argue that self-interest plays a major but underappreciated role in public opinion on a variety of issues. American University political scientist Liz Suhay has written a review, in Perspectives on Politics, and I want to address a couple of points (mostly about the relationship between evolutionary psychology and behavioral genetics). Suhay’s review is smart and perceptive about what we were trying to do with the book, but then seriously misunderstands our views in the end. And it’s in large part my own fault—she’s trying to read between lines we didn’t write (or, at least, didn’t write in that book), providing room for misinterpretation.

Suhay sees our “(relatively) hidden agenda” as “orienting political science in such a way that theoretical frameworks from evolutionary psychology are a sensible next step.” I wouldn’t put it exactly that way, but it’s close. We started this research from an evolutionary viewpoint, looking at some previously unnoticed connections between clashing interests and opposing opinions on sexual politics (on abortion and recreational drugs). That led us to want to take a broader look, where we found all sorts of connections, not just in sexual politics, but for issues involving race, immigration, religion, sexual orientation, income redistribution, social welfare, and so on.

So we decided to write a book. Now, what is the book to be about? It turns out that there’s a deeply embedded position in political science that states quite generally that self-interest barely matters when it comes to political issues. In the end, we decided the book was about pointing to and staring at the relevant demographic patterns. That’s the first hurdle to be cleared. You really think self-interest doesn’t relate to the public’s issue positions? For fuck’s sake, look!

Beyond this main theme, there were other things we needed to address. But we decided not to make the book an explicit defense of evolutionary psychology. While evolutionary psychology had provided our own conceptual framework, we didn’t think it was important that someone accept that framework in order to see the domain-specific demographic patterns of public opinion.

And it was that decision that led to our misunderstanding with Suhay. She can tell that we’re coming from an evolutionary perspective. But we didn’t make our evolutionary framework explicit. In attempting to fill in the blanks, Suhay viewed our discussion of behavioral genetics in chapter 10 as the core of our evolutionary viewpoint. This is entirely wrong.

The evolutionary core of the book comes in the second half of chapter 2 (and a little in the middle of chapter 3). The point is that, while political science has tended to equate self-interest with short-term economic self-interest, an evolutionary view expands the range of motivating human interests and sees many of our normal emotional reactions as guided by our perceptions regarding that wider range of interests. People don’t just care about and compete over getting money in the short-term, but more generally over resources, social status, mating relationships, and so on. This evolutionary perspective doesn’t draw sharp distinctions such that, for example, disagreements over income redistribution might involve self-interest but disagreements over sexual and reproductive policy cannot be self-interested. Our view on “inclusive interests” is based in a fuller view of human competitive concerns.

Had we dove into evolutionary psychology more explicitly, we would have noted that every sane evolutionary psychologist rejects genetic determinism and believes, as we do, that human reactions to social situations are complex, involving contingent responses based on a variety of personal, ecological, and social circumstances. It might be generally true that people seek enhanced social status, for example, but how this translates into individual political opinions relates to lots of additional details. What are the realistic options in one’s society for how social status can be advanced? What are one’s personal features that would make some options more attractive than others? What are one’s coalitional opportunities? And so on.

Thus, when we looked at modern U.S. data on social status issues, we included education and test performance (as measures of meritocratic competence) along with various group memberships (race, religion, sexual orientation, etc.). Our findings included, among others, that people with high meritocratic competence but who would be disadvantaged by traditional group-based discrimination (because they’re non-white, or non-Christian, or non-straight, or immigrants, or women) tend very strongly to oppose anti-meritocratic discrimination against people like themselves. Does this mean that there’s something inherent in these folks that makes anti-discrimination views preferable regardless of the relevant social circumstances? Of course not. It means that when you plug a general (evolutionary) desire for higher social status into a set of social circumstances in which the big competition is between meritocratic rules and discriminatory rules, and in which certain specific social distinctions (based on race, religion, etc.) tend to ground discrimination efforts, people generally sort through the relevant facts on the ground and land in a self-interested political position.

Suhay’s identification of our evolutionary position with behavioral genetics is not what we meant and not what we said. In general, behavioral genetics and evolutionary psychology are very different enterprises—the former is about individual genetic variance, while the latter is about widely shared, species-typical social goals and psychological mechanisms.

More specifically, we were clear in the book that we don’t think that there’s a “pro-life gene” or a “healthcare subsidy gene” and so on. What we mean by this is just what I indicated above—that political positions are formed from the interaction of widely shared goals with a variety of individual, social, and ecological contingencies. Some of those individual contingencies are in part based on genetic differences. One example we gave is sociosexuality (i.e., how turned on one is by the idea of casual sex). We cite evidence that individual differences in sociosexuality relate in part to genetic differences, but studies also show that societal-level differences relate to, e.g., sex ratios and measures of familial stress. We speculate in that section that the fact that there is some substantial measure of genetic variance in sociosexuality might help explain why there’s also some genetic variance in views on sexual politics—genetic differences (interacting with various kinds of differences in rearing households and societies) help drive sexual lifestyle differences, and the lifestyle differences then become an interest-based factor affecting views on sexual and reproductive political issues (because people are generally motivated to seek advantages for people with their own sexual lifestyles).

The “evolutionary” portion of that account isn’t the fact that genetic differences affect lifestyle differences. It’s instead in the motivations to seek various kinds of social advantages for one’s self and family. The genetic differences are one of many contingent factors that make people with the same general motivations end up with widely contrasting political views. Our dismissal of “socialization” was not a broad dismissal of social factors, but a specific dismissal of the notion that the bulk of adult political views are driven by children learning those views from their parents (we talked about it as the “raised-that-way” view). I stand by what we said there—behavioral genetic studies that find small shared environment effects are devastating for the raised-that-way theory.

Suhay laments that we didn’t just say: “We all seek resources and respect; some of us are born into groups (race, gender, class) that have relatively more or less of those things; our political views reflect this.” The thing is, I really thought that’s basically what we in fact said. I mean, we said more than that, but we also basically said what she said. At least I thought we did.

In lots of ways, Suhay makes charitable assumptions about our work. However, when it comes to our sidebar discussion of behavioral genetics, she switches to the assumption that we’re crazy people. But in fact, I suspect that on these topics Suhay and I have more agreements than differences.

Churchgoers are restricted individuals in fast groups

We’ve reached the final post in this series. In the first one, I noted that evolutionary researchers have made starkly opposing claims about whether religiosity is driven by fast or slow life history. I then covered a big problem with the fast view: It’s based on group-level data, which can’t tell us about individual-level patterns. Then I discussed a big weakness in the slow view: It claims that unrestricted/restricted sociosexuality is a component of fast/slow life history, when in fact these don’t empirically align in the manner claimed.

Now we’re ready for the resolution. The answer is right there in the title.

In yesterday’s post, I discussed two lifestyle factors—a sociosexuality factor and a fast/slow life history factor—in data from two large publicly available datasets (the GSS and the NLSY97). The sociosexuality factor measures primarily whether people have few or lots of sex partners, do little or lots of partying, and have high-commitment or low-commitment relationships. The fast/slow factor measures primarily whether people have early kids or not, lots of or few kids, and little or lots of education.

At the individual level, does church attendance relate primarily to sociosexuality or to fast/slow life history? The unambiguous answer is that individual-level church attendance in the U.S. relates very substantially to sociosexuality, and hardly at all to the overall measure of fast/slow life history. Churchgoers tend strongly to have restricted sociosexual patterns (few partners, little partying, committed relationships) while church-avoiders tend strongly to have unrestricted patterns, and this is happens without much regard for overall fast/slow life history patterns.

When there are individual-level relationships between churchgoing and core fast/slow measures, they’re smaller and inconsistent. For example, in the GSS, having more children moderately correlates with going to church, but having a child early does not. Put those in a multiple regression and the result is that churchgoers tend to have more children but tend not to have started having them at very young ages. This is because there are different life history paths to having lots of children. The sociosexually restricted paths involve stable monogamous relationships that tend to start after teen years but nonetheless lead to high completed fertility. In a related point, while a multiple regression will show churchgoers having more kids, it will also show them having more education.

Thus we have the first part of the conclusion: In the U.S. (and I suspect in other developed counties as well), churchgoers tend strongly to be restricted individuals.

But we’ve also got evidence from group-level studies that churchgoers come from fast groups. Does that pan out with the two-factor approach? Yes. In both the GSS and NLSY97 samples, I created variables contrasting racial/regional groups that have higher and lower average church attendance—it’s basically African Americans and southerners on the high side and northeasterners and whites on the low side. Here, African Americans and southerners do show substantial average differences from northeasterners and whites in early births, fertility, and education, but there aren’t large overall differences in sociosexuality.

Thus we have the second part of the conclusion: In the U.S. (and I suspect this is largely true elsewhere), churchgoers have faster folks in their racial and regional groups.

Taking a step back, here’s what I think is likely true about the big patterns in religiosity. There seems to be a loose societal-level pattern these days where you have poor-fast-restricted-religious societies and rich-slow-unrestricted-secular ones. (There are various exceptions, of course. For example, societies with a history of communism tend to be poorer but less religious, and the U.S. has higher religiosity than its high wealth would suggest.) At the individual level, we have evidence from the U.S. that (1) fast/slow patterns don’t line up with unrestricted/restricted patterns and (2) it’s the unrestricted/restricted patterns that strongly relate to religiosity. I suspect these are more-or-less true in other developed countries, but I don’t think we know that either are true of less developed countries (I’m thinking, for example, about how sexual morals aren’t big individual-level correlates of religiosity in poorer world regions). Also, when it comes to pre-20th century societies, I’m not sure we have more than a vague sense of how the key relationships worked at the group and individual levels—how fast/slow related to unrestricted/restricted and how religiosity related to lifestyles.

Every time I take a close look at religion data, I learn some new wrinkle that lengthens rather than shortens the story. It would be nice if we could have a super-simple account here, but nature is sometimes an asshole and won’t let us have nice things.